single PDF of the entire issue - The Royal New Zealand College of ...
single PDF of the entire issue - The Royal New Zealand College of ...
single PDF of the entire issue - The Royal New Zealand College of ...

You also want an ePaper? Increase the reach of your titles
YUMPU automatically turns print PDFs into web optimized ePapers that Google loves.
ORIGINAL SCIENTIFIC PAPErS<br />
quantitative research<br />
and statins (70%) for <strong>the</strong> 1003 patients examined.<br />
31 Among ano<strong>the</strong>r sample <strong>of</strong> 232 people with<br />
CVD from three <strong>New</strong> <strong>Zealand</strong> general practices,<br />
aspirin was prescribed to 74%, statins to 65% and<br />
BPL medications to 79% <strong>of</strong> participants. 15 Our<br />
findings may represent a ‘best case scenario’ as<br />
<strong>the</strong> study population was identified by primary<br />
care teams who were taking an active approach to<br />
CVD management by using <strong>the</strong> PREDICT decision<br />
support system. We were unable to investigate<br />
<strong>the</strong> use <strong>of</strong> aspirin. Records <strong>of</strong> dispensing<br />
were available for 67% <strong>of</strong> our study population,<br />
which probably reflects patients purchasing this<br />
medication over <strong>the</strong> counter to avoid prescriptionrelated<br />
costs.<br />
<strong>The</strong> lower level <strong>of</strong> dispensing in younger people<br />
with CVD is significant given <strong>the</strong>ir greater potential<br />
and productive years <strong>of</strong> life lost compared<br />
with older age groups. This is particularly salient<br />
for Maori, Pacific and Indian people, whose populations<br />
have a younger age structure than <strong>the</strong><br />
total <strong>New</strong> <strong>Zealand</strong> population. 32–34 Various factors<br />
could account for this age discrepancy. Firstly,<br />
general practitioners (GPs) might still be managing<br />
CVD using a risk factor–based approach ra<strong>the</strong>r<br />
than according to absolute cardiovascular risk.<br />
<strong>The</strong>refore, <strong>the</strong>y may be unwilling to commence<br />
pharmaco<strong>the</strong>rapy for those younger patients with<br />
CVD who do not have elevated blood pressure<br />
or lipids. Younger people may also be less likely<br />
than older patients to decide in favour <strong>of</strong> taking<br />
secondary prevention medications. 35,36 <strong>The</strong><br />
reasons for this are likely to be multifactorial,<br />
and include financial pressures such as dependent<br />
children, and an arguably greater likelihood <strong>of</strong><br />
poor lifestyle and health choices among younger<br />
people with CVD. Medication costs may also<br />
have been a deterrent for people aged less than 45<br />
years until July 2007, when prescription charges<br />
incurred by PHO enrolees from this age group<br />
reduced markedly.<br />
Various studies have noted reduced dispensing to<br />
older people, related to drug–drug interactions,<br />
drug–comorbid disease interactions, physiological<br />
intolerance and patient wishes against<br />
treatment. 3,7–11 We did not observe this finding,<br />
possibly due to <strong>the</strong> exclusion <strong>of</strong> people aged 75<br />
years or older.<br />
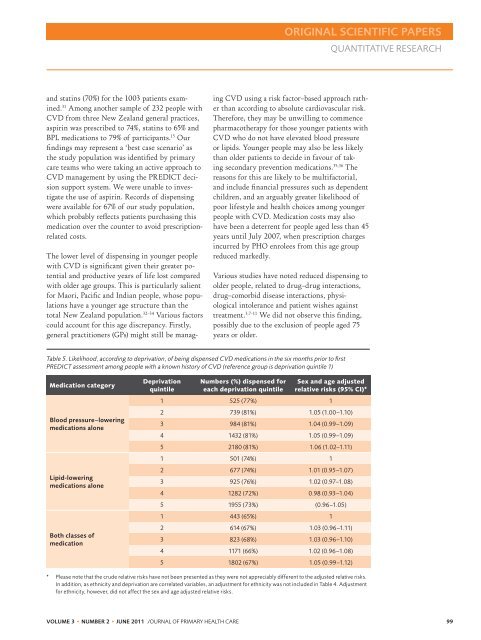
Table 5. Likelihood, according to deprivation, <strong>of</strong> being dispensed CVD medications in <strong>the</strong> six months prior to first<br />
PREDICT assessment among people with a known history <strong>of</strong> CVD (reference group is deprivation quintile 1)<br />
Medication category<br />
Blood pressure–lowering<br />
medications alone<br />
Lipid-lowering<br />
medications alone<br />
Both classes <strong>of</strong><br />
medication<br />
Deprivation<br />
quintile<br />
Numbers (%) dispensed for<br />
each deprivation quintile<br />
Sex and age adjusted<br />
relative risks (95% CI)*<br />
1 525 (77%) 1<br />
2 739 (81%) 1.05 (1.00–1.10)<br />
3 984 (81%) 1.04 (0.99–1.09)<br />
4 1432 (81%) 1.05 (0.99–1.09)<br />
5 2180 (81%) 1.06 (1.02–1.11)<br />
1 501 (74%) 1<br />
2 677 (74%) 1.01 (0.95–1.07)<br />
3 925 (76%) 1.02 (0.97–1.08)<br />
4 1282 (72%) 0.98 (0.93–1.04)<br />
5 1955 (73%) (0.96–1.05)<br />
1 443 (65%) 1<br />
2 614 (67%) 1.03 (0.96–1.11)<br />
3 823 (68%) 1.03 (0.96–1.10)<br />
4 1171 (66%) 1.02 (0.96–1.08)<br />
5 1802 (67%) 1.05 (0.99–1.12)<br />
* Please note that <strong>the</strong> crude relative risks have not been presented as <strong>the</strong>y were not appreciably different to <strong>the</strong> adjusted relative risks.<br />
In addition, as ethnicity and deprivation are correlated variables, an adjustment for ethnicity was not included in Table 4. Adjustment<br />
for ethnicity, however, did not affect <strong>the</strong> sex and age adjusted relative risks.<br />
VOLUME 3 • NUMBER 2 • JUNE 2011 J OURNAL OF PRIMARY HEALTH CARE 99