Gap Inc. Equity Valuation and Analysis Valued at November 1, 2006
Gap Inc. Equity Valuation and Analysis Valued at November 1, 2006
Gap Inc. Equity Valuation and Analysis Valued at November 1, 2006

You also want an ePaper? Increase the reach of your titles
YUMPU automatically turns print PDFs into web optimized ePapers that Google loves.
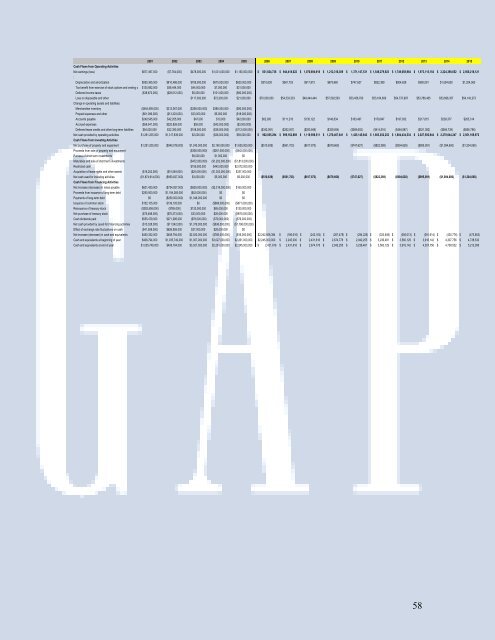
2001 2002 2003 2004 2005 <strong>2006</strong> 2007 2008 2009 2010 2011 2012 2013 2014 2015<br />
Cash Flows from Oper<strong>at</strong>ing Activities<br />
Net earnings (loss) $877,497,000 ($7,764,000) $478,000,000 $1,031,000,000 $1,150,000,000 $ 831,824,736 $ 944,418,622 $ 1,070,694,918 $ 1,212,316,309 $ 1,371,147,531 $ 1,549,279,923 $ 1,749,058,964 $ 1,973,115,154 $ 2,224,398,652 $ 2,506,218,121<br />
:<br />
Depreci<strong>at</strong>ion <strong>and</strong> amortiz<strong>at</strong>ion $590,365,000 $810,486,000 $706,000,000 $675,000,000 $620,000,000 $510,639 $561,703 $617,873 $679,660 $747,627 $822,389 $904,628 $995,091 $1,094,600 $1,204,060<br />
Tax benefit from exercise of stock options <strong>and</strong> vesting o $130,882,000 $58,444,000 $44,000,000 $7,000,000 $31,000,000<br />
Deferred income taxes ($38,872,000) ($28,512,000) $5,000,000 $101,000,000 ($80,000,000)<br />
Loss on disposable <strong>and</strong> other $117,000,000 $72,000,000 $21,000,000 $70,000,000 $54,333,333 $48,444,444 $57,592,593 $53,456,790 $53,164,609 $54,737,997 $53,786,465 $53,896,357 $54,140,273<br />
Change in oper<strong>at</strong>ing assets <strong>and</strong> liabilities:<br />
Merch<strong>and</strong>ise inventory ($454,595,000) $213,067,000 ($258,000,000) $385,000,000 ($90,000,000)<br />
Prepaid expenses <strong>and</strong> other ($61,096,000) ($13,303,000) $33,000,000 $5,000,000 ($18,000,000)<br />
Accounts payable $249,545,000 $42,205,000 $47,000 $10,000 $42,000,000 $62,000 $111,218 $135,122 $148,634 $163,497 $179,847 $197,832 $217,615 $239,377 $263,314<br />
Accrued expenses ($56,541,000) $220,826,000 $55,000 ($42,000,000) ($3,000,000)<br />
Deferred lease credits <strong>and</strong> other long-term liabilities $54,020,000 $22,390,000 $108,000,000 ($38,000,000) ($112,000,000) ($342,081) ($262,007) ($293,846) ($329,554) ($369,602) ($414,516) ($464,887) ($521,382) ($584,739) ($655,796)<br />
Net cash provided by oper<strong>at</strong>ing activities $1,291,205,000 $1,317,839,000 $2,000,000 ($26,000,000) $59,000,000 $ 902,055,294 $ 999,162,869 $ 1,119,598,511 $ 1,270,407,641 $ 1,425,145,843 $ 1,603,032,252 $ 1,804,434,534 $ 2,027,592,944 $ 2,279,044,247 $ 2,561,169,972<br />
Cash Flows from Investing Activities<br />
Net purchase of property <strong>and</strong> equipment $1,291,205,000 ($940,078,000) $1,243,000,000 $2,160,000,000 $1,620,000,000 ($510,639) ($561,703) ($617,873) ($679,660) ($747,627) ($822,389) ($904,628) ($995,091) ($1,094,600) ($1,204,060)<br />
Proceeds from sale of property <strong>and</strong> equipment ($308,000,000) ($261,000,000) ($442,000,000)<br />
Purcase of short term investments $9,000,000 $1,000,000 $0<br />
M<strong>at</strong>ur<strong>at</strong>ies <strong>and</strong> sale of short term investments ($472,000,000) ($1,202,000,000) ($1,813,000,000)<br />
Restricted cash $159,000,000 $442,000,000 $2,072,000,000<br />
Acquisition of lease rights <strong>and</strong> other assets ($16,252,000) ($10,549,000) ($20,000,000) ($1,303,000,000) $337,000,000<br />
Net cash used for investing activities ($1,874,914,000) ($950,627,000) $3,000,000 $5,000,000 $6,000,000 ($510,639) ($561,703) ($617,873) ($679,660) ($747,627) ($822,389) ($904,628) ($995,091) ($1,094,600) ($1,204,060)<br />
Cash Flows from Financing Activities<br />
Net increase (decrease) in notes payable $621,420,000 ($734,927,000) ($629,000,000) ($2,318,000,000) $160,000,000<br />
Proceeds from issuance of long-term debt $250,000,000 $1,194,265,000 ($42,000,000) $0 $0<br />
Payments of long-term debt $0 ($250,000,000) $1,346,000,000 $0 $0<br />
Issuance of common stock $152,105,000 $139,105,000 $0 ($668,000,000) ($871,000,000)<br />
Reissuance of treasury stock ($392,558,000) ($785,000) $120,000,000 $85,000,000 $130,000,000<br />
Net purchase of treasury stock ($75,488,000) ($76,373,000) $33,000,000 $26,000,000 ($976,000,000)<br />
Cash dividends paid $555,479,000 $271,285,000 ($78,000,000) ($79,000,000) ($79,000,000)<br />
Net cash provided by (used for) financing activities ($13,328,000) ($11,542,000) $1,379,000,000 ($636,000,000) ($1,796,000,000)<br />
Effect of exchange r<strong>at</strong>e fluctu<strong>at</strong>ions on cash ($41,558,000) $626,955,000 $27,000,000 $28,000,000 $0<br />
Net increase (decrease) in cash <strong>and</strong> equivalents $450,352,000 $408,794,000 $2,020,000,000 ($766,000,000) ($16,000,000) $2,242,568,384 $ (186,616) $ (243,162) $ (267,478) $ (294,226) $ (323,648) $ (356,013) $ (391,614) $ (430,776) $ (473,853)<br />
Cash <strong>and</strong> equivalents <strong>at</strong> beginning of year $408,794,000 $1,035,749,000 $1,007,000,000 $3,027,000,000 $2,261,000,000 $2,245,000,000 $ 2,245,000 $ 2,431,616 $ 2,674,778 $ 2,942,255 $ 3,236,481 $ 3,560,129 $ 3,916,142 $ 4,307,756 $ 4,738,532<br />
Cash <strong>and</strong> equivalents <strong>at</strong> end of year $1,035,749,000 $408,794,000 $3,027,000,000 $2,261,000,000 $2,245,000,000 $ 2,431,616 $ 2,431,616 $ 2,674,778 $ 2,942,255 $ 3,236,481 $ 3,560,129 $ 3,916,142 $ 4,307,756 $ 4,738,532 $ 5,212,385<br />
58