- Page 1 and 2:
Annual Report of ACS Group 2009
- Page 3:
Activity Report of ACS Group 2009
- Page 6 and 7:
Main figures of the ACS Group Turno
- Page 8 and 9:
Annual Report of ACS Group Construc
- Page 10 and 11:
Letter from the Chairman Dear share
- Page 12 and 13:
Management Bodies Board of Director
- Page 14 and 15:
Management Bodies Management Commit
- Page 16 and 17:
Management Bodies Management Team A
- Page 18 and 19:
Corporate Strategy Vision A worldwi
- Page 20 and 21:
Corporate Strategy History 1983 198
- Page 22 and 23:
Construction Sector environment 18
- Page 24 and 25:
Construction Sector environment Dom
- Page 26 and 27:
Construction Public tenders for civ
- Page 28 and 29:
Construction In addition, the Gover
- Page 30 and 31:
Construction Business Strategy The
- Page 32 and 33:
Construction The ACS Group's focus
- Page 34 and 35:
Construction At 31 December 2009 th
- Page 36 and 37:
Construction North America The cont
- Page 38 and 39: Construction Main contracts awarded
- Page 40 and 41: Concessions Sector environment 36 B
- Page 42 and 43: Concessions Sector environment The
- Page 44 and 45: Concessions Activity description Wh
- Page 46 and 47: Concessions Relevant events Within
- Page 48 and 49: Concessions Contracts awarded In 20
- Page 50 and 51: Environment Sector environment 46 B
- Page 52 and 53: Environment Sector environment The
- Page 54 and 55: Environment Waste management is a f
- Page 56 and 57: Environment Other areas of expansio
- Page 58 and 59: Environment Activity description In
- Page 60 and 61: Environment Within the water cycle,
- Page 62 and 63: Environment Included in the area of
- Page 64 and 65: Environment Environment activities
- Page 66 and 67: Environment Main contracts awarded
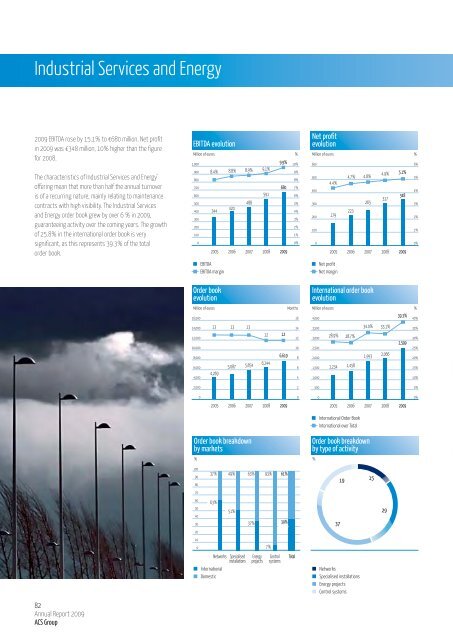
- Page 68 and 69: Industrial Services and Energy Sect
- Page 70 and 71: Industrial Services and Energy Sect
- Page 72 and 73: Industrial Services and Energy Inve
- Page 74 and 75: Industrial Services and Energy Stru
- Page 76 and 77: Industrial Services and Energy In t
- Page 78 and 79: Industrial Services and Energy Inve
- Page 80 and 81: Industrial Services and Energy Acti
- Page 82 and 83: Industrial Services and Energy In E
- Page 84 and 85: Industrial Services and Energy Wind
- Page 86 and 87: Industrial Services and Energy Ther
- Page 90 and 91: Industrial Services and Energy Amon
- Page 92 and 93: Industrial Services and Energy Main
- Page 94 and 95: Strategic Investments Abertis 91 Ib
- Page 96 and 97: Strategic Investments The ACS Group
- Page 98 and 99: Strategic Investments Internacional
- Page 100 and 101: Strategic Investments Hochtief The
- Page 102 and 103: Main Economic-Financial figures of
- Page 104 and 105: Main Economic-Financial figures of
- Page 106 and 107: The ACS Group and Corporate Respons
- Page 108 and 109: The ACS Group and Corporate Respons
- Page 110 and 111: The ACS Group and Corporate Respons
- Page 112 and 113: The ACS Group and Corporate Respons
- Page 114 and 115: Corporate Governance in the ACS Gro
- Page 116: Corporate Governance in the ACS Gro
- Page 119 and 120: ACS, Servicios, Comunicaciones y En
- Page 121 and 122: Economic and Financial Report of AC
- Page 123 and 124: Profitability
- Page 125 and 126: The year 2009 was very positive for
- Page 127 and 128: 1.02.01. Revenue Revenue amounted t
- Page 129 and 130: 1.02.06. Net profit attributable to
- Page 131 and 132: 1.03.01. Non-current assets Intangi
- Page 133 and 134: The balance of Corporate Unit inves
- Page 135 and 136: Net profit amounted to EUR 241.4 mi
- Page 137 and 138: 1.05.04. Industrial Services Main f
- Page 139 and 140:
2. Stock market performance 2.01. S
- Page 141 and 142:
2.02. Treasury shares At 31 Decembe
- Page 143 and 144:
In the Environment area, efforts ar
- Page 145 and 146:
As provided in Article 6 of its Com
- Page 147 and 148:
Additionally, at its meeting held o
- Page 149 and 150:
elating to the share capital figure
- Page 151 and 152:
Equity and liabilities Note 31/12/2
- Page 153 and 154:
Consolidated statements of comprehe
- Page 155 and 156:
Consolidated statements of cash flo
- Page 157 and 158:
8. The direction and execution of a
- Page 159 and 160:
28. The acquisition, holding, use,
- Page 161 and 162:
2.02. Basis of consolidation a) Bal
- Page 163 and 164:
Investments in associates are accou
- Page 165 and 166:
The detail of the allocation of the
- Page 167 and 168:
In both cases, at the end of each r
- Page 169 and 170:
The period property, plant and equi
- Page 171 and 172:
Gains or losses arising from the re
- Page 173 and 174:
3.08.05. Derecognition of financial
- Page 175 and 176:
In relation to the assets and liabi
- Page 177 and 178:
3.12.02. Trade and other payables T
- Page 179 and 180:
Provisions for completion of constr
- Page 181 and 182:
In an agency relationship, when the
- Page 183 and 184:
3.20. Earnings per share Basic earn
- Page 185 and 186:
Following is a brief summary thereo
- Page 187 and 188:
Interpretations: Mandatory Applicat
- Page 189 and 190:
Line of Business Thousands of euros
- Page 191 and 192:
5. Property, plant and equipment Th
- Page 193 and 194:
6. Non-current assets in projects T
- Page 195 and 196:
The Group's investment property rel
- Page 197 and 198:
The detail, by company, of the inve
- Page 199 and 200:
10. Financial assets The detail of
- Page 201 and 202:
The full transaction was financed,
- Page 203 and 204:
At 31 December 2009, this heading i
- Page 205 and 206:
Substantially all the risks and rew
- Page 207 and 208:
15.02. Share premium The share prem
- Page 209 and 210:
At 31 December 2009, the Group held
- Page 211 and 212:
15.07. Non-controlling interests Th
- Page 213 and 214:
At 31 December 2009, the shareholde
- Page 215 and 216:
The detail of the bank borrowings a
- Page 217 and 218:
18. Limited recourse financing of p
- Page 219 and 220:
The main characteristics of the fin
- Page 221 and 222:
20. Provisions The changes in non-c
- Page 223 and 224:
Foreign currency risk The foreign c
- Page 225 and 226:
The capital structure is mainly con
- Page 227 and 228:
The following table shows the fair
- Page 229 and 230:
24. Other current liabilities The d
- Page 231 and 232:
25.02.02. Income statement by busin
- Page 233 and 234:
25.02.04. Statement of financial po
- Page 235 and 236:
The breakdown of certain of the Gro
- Page 237 and 238:
26.05. Tax recognised in equity In
- Page 239 and 240:
In 2009 foreign currency transactio
- Page 241 and 242:
28.03. Share-based payments In 2009
- Page 243 and 244:
29. Impairment and gains on the dis
- Page 245 and 246:
33. Balances and transactions with
- Page 247 and 248:
Other Transactions Thousands of eur
- Page 249 and 250:
Other Transactions Thousands of eur
- Page 251 and 252:
34.01. Transactions with members of
- Page 253 and 254:
Also pursuant to the aforementioned
- Page 255 and 256:
In 2009 the Company performed comme
- Page 257 and 258:
The whole of the treatments in plan
- Page 259 and 260:
Company Registered Office Activity
- Page 261 and 262:
Company Registered Office Activity
- Page 263 and 264:
Company Registered Office Activity
- Page 265 and 266:
Company Registered Office Activity
- Page 267 and 268:
Company Registered Office Activity
- Page 269 and 270:
Company Registered Office Activity
- Page 271 and 272:
Company Address Activity Auditor %
- Page 273 and 274:
UTE/EIG Address Activity Auditor %
- Page 275 and 276:
Data on the investee (100%) Company
- Page 277 and 278:
Held for sale (SPL): A.T.M. Cartera
- Page 279 and 280:
159 Economic and Financial Report A
- Page 281:
Consolidated balance sheet as of De
- Page 285 and 286:
Corporate Responsibility Report of
- Page 287 and 288:
Industrial Services Area of Activit
- Page 289 and 290:
Commitment
- Page 291 and 292:
The ACS Group is a worldwide refere
- Page 293 and 294:
The following outstanding initiativ
- Page 295 and 296:
ACS and its Stakeholderss Stakehold
- Page 297 and 298:
Main Milestones in 2009 Investment
- Page 299 and 300:
The ACS Group’s activity, which i
- Page 301 and 302:
Professional Team: hiring and retai
- Page 303 and 304:
Creation of value for shareholders
- Page 305 and 306:
ACS: leading value creation between
- Page 307 and 308:
Creation of Value for the societies
- Page 309 and 310:
The transparency and rigour in the
- Page 311 and 312:
Information transparency, the pilla
- Page 313 and 314:
Each year, the investment and effor
- Page 315 and 316:
Construction R+D+i activity continu
- Page 317 and 318:
Outstanding among these activities
- Page 319 and 320:
4D visual For planning of linear wo
- Page 321 and 322:
Environment Within the Environment
- Page 323 and 324:
Thermal Solar Energy This is centre
- Page 325 and 326:
Also related with renewable energie
- Page 327 and 328:
Given the commitment of ACS to the
- Page 329 and 330:
The results of the combined analysi
- Page 331 and 332:
Environmental performance Main envi
- Page 333 and 334:
Waste indicators Below is a table o
- Page 335 and 336:
Scope 3: Other indirect emissions S
- Page 337 and 338:
Description of the project Exploita
- Page 339 and 340:
Compensatory measures for La Breña
- Page 341 and 342:
Botanical Garden and Interpretation
- Page 343 and 344:
Monitoring of the achievement of 20
- Page 345 and 346:
INITEC Energia establishes an Envir
- Page 347 and 348:
Renewable energy, main figures The
- Page 349 and 350:
The quality and skills of the profe
- Page 351 and 352:
Hiring and Retaining policies The A
- Page 353 and 354:
In short, the ACS Group always trie
- Page 355 and 356:
Distribution of hours of e-learning
- Page 357 and 358:
Performance evaluation In ACS, 2,96
- Page 359 and 360:
However, Dragados, with its philoso
- Page 361 and 362:
Initiatives for the reconciliation
- Page 363 and 364:
Commitment to ACS Group suppliers a
- Page 365 and 366:
Philanthropy in Dragados In Dragado
- Page 367 and 368:
Noteworthy in 2009 were activities
- Page 369 and 370:
Principle of materiality The ACS Gr
- Page 371 and 372:
We would like to know your opinion
- Page 373 and 374:
87 Corporate Responsibility Report
- Page 375 and 376:
Cross-Reference 3.8 Basis for repor
- Page 377 and 378:
Environmental Cross-Reference Discl
- Page 379:
Society Cross-Reference Disclosure
- Page 385 and 386:
Corporate Governance Report of ACS
- Page 387 and 388:
Trust
- Page 389 and 390:
Indicate the most significant chang
- Page 391 and 392:
Indicate whether the company is awa
- Page 393 and 394:
Indicate whether there are statutor
- Page 395 and 396:
Proprietary & External Board Member
- Page 397 and 398:
B.1.5 Indicate whether any Board Me
- Page 399 and 400:
B.1.11 Complete the following table
- Page 401 and 402:
B.1.13 Indicate on an aggregate bas
- Page 403 and 404:
Detail of any relevant relationship
- Page 405 and 406:
The provisions set forth in these r
- Page 407 and 408:
B.1.23 State whether there are spec
- Page 409 and 410:
Identify, if applicable, the person
- Page 411 and 412:
B.1.37 Indicate if the auditing fir
- Page 413 and 414:
Detail of procedure Article 15 of t
- Page 415 and 416:
B.2.3 Provide a description of the
- Page 417 and 418:
B.2.5 Indicate, if applicable, if t
- Page 419 and 420:
Likewise, on regulating the non-com
- Page 421 and 422:
The Monitoring Unit, through its Ch
- Page 423 and 424:
to be easily monitored and controll
- Page 425 and 426:
D.2 Indicate if any of the differen
- Page 427 and 428:
D.4 Identification and description
- Page 429 and 430:
E.5 Indicate if the position of Cha
- Page 431 and 432:
(In relation to this item, it was r
- Page 433 and 434:
6. Companies shall allow split vote
- Page 435 and 436:
12. Among external Board Members, t
- Page 437 and 438:
21. When Board Members or the Secre
- Page 439 and 440:
It is to our understanding that hol
- Page 441 and 442:
37. Board Member remuneration shall
- Page 443 and 444:
c) Their Chairmen shall be independ
- Page 445 and 446:
Complies Partially complies Explain
- Page 447 and 448:
Also included were the “intermedi
- Page 449 and 450:
• The financial information to be
- Page 451 and 452:
h) Review and report on the estimat
- Page 458:
Project Director and Editor ACS Gro