by Dirk Dusharme - Quality Digest
by Dirk Dusharme - Quality Digest
by Dirk Dusharme - Quality Digest

Create successful ePaper yourself
Turn your PDF publications into a flip-book with our unique Google optimized e-Paper software.
enefits are the prime motivator, followed<br />
<strong>by</strong> competition at 45 percent and market<br />
pressure at 18 percent.<br />
This raises the question of whether<br />
companies that are required to register<br />
view the value of registration from a marketing<br />
perspective only, or whether they<br />
believe the standard adds value to the<br />
company’s overall quality objective.<br />
“I think this varies <strong>by</strong> industry,” says<br />
Gary Minks, certification body director for<br />
TÜV America. “Companies in regulated<br />
manufacturing areas like the medical devices<br />
industry may not initially see the value.<br />
For example, to CE Mark a medical device<br />
for Europe, one requirement is having a<br />
quality management system in place. The<br />
prime motivator there is the industry requirement,<br />
but even where it isn’t required, certified<br />
companies do see the value.”<br />
To test whether companies see intrinsic<br />
value to registration, we asked if they<br />
would keep their registration even if it<br />
wasn’t required. Only 16 percent indicate<br />
they wouldn’t. More than 60 percent of<br />
respondents say they would keep their<br />
registration even if it wasn’t required, and<br />
the remainder are unsure. One interpretation<br />
of this data is that, as Minks points out,<br />
the initial motivator might be an industry<br />
requirement, but eventually companies<br />
see the internal value as well.<br />
Accreditation<br />
About 90 percent of respondents indicate<br />
that their ISO 9001 registration came<br />
from an accredited registrar, and their<br />
response to the question, “What value do<br />
you place on this accreditation” indicates<br />
that they value it.<br />
Fifty-one percent of respondents say<br />
they place great value on accreditation,<br />
while 38 percent place only some value<br />
on it. In addition, as shown in table 5,<br />
43 percent indicate they wouldn’t keep<br />
their registration if the certificate wasn’t<br />
accredited, whereas 29 percent indicate<br />
they would keep it. When this question<br />
was asked only of those who put great<br />
value on accreditation, 56 percent indicate<br />
they wouldn’t keep it, and 20 percent<br />
say they would.<br />
“I think that a heavy percentage of<br />
those [who would keep an unaccredited<br />
certificate] may not understand the value,”<br />
says Minks. “Chances are their customers<br />
wouldn’t accept a certificate if it wasn’t<br />
accredited. The accreditation mark gives<br />
the customer the assurance that the registrar<br />
is creditable. It also ensures that all<br />
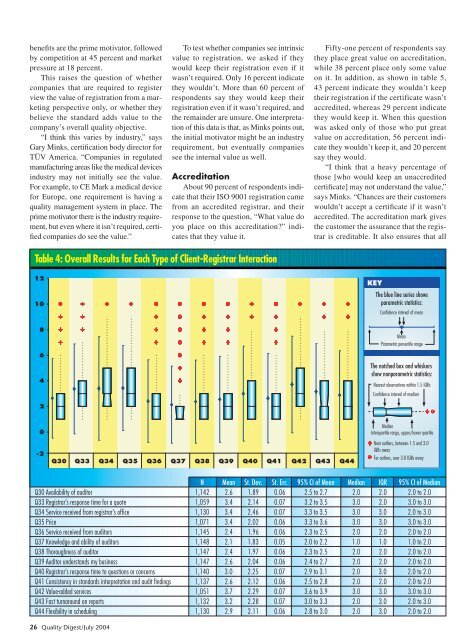
Table 4: Overall Results for Each Type of Client-Registrar Interaction<br />
12<br />
10<br />
KEY<br />
The blue line series shows<br />
parametric statistics:<br />
Confidence interval of mean<br />
8<br />
6<br />
4<br />
Mean<br />
Parametric percentile range<br />
The notched box and whiskers<br />
show nonparametric statistics:<br />
Nearest observations within 1.5 IQRs<br />
Confidence interval of median<br />
2<br />
0<br />
-2<br />
Q30 Q33 Q34 Q35 Q36 Q37 Q38 Q39 Q40 Q41 Q42 Q43 Q44<br />
Median<br />
Interquartile range, upper/lower quartile<br />
Near outliers, between 1.5 and 3.0<br />
IQRs away<br />
Far outliers, over 3.0 IQRs away<br />
N Mean St. Dev. St. Err. 95% CI of Mean Median IQR 95% CI of Median<br />
Q30 Availability of auditor 1,142 2.6 1.89 0.06 2.5 to 2.7 2.0 2.0 2.0 to 2.0<br />
Q33 Registrar’s response time for a quote 1,059 3.4 2.14 0.07 3.2 to 3.5 3.0 2.0 3.0 to 3.0<br />
Q34 Service received from registrar’s office 1,130 3.4 2.46 0.07 3.3 to 3.5 3.0 3.0 2.0 to 3.0<br />
Q35 Price 1,071 3.4 2.02 0.06 3.3 to 3.6 3.0 3.0 3.0 to 3.0<br />
Q36 Service received from auditors 1,145 2.4 1.96 0.06 2.3 to 2.5 2.0 2.0 2.0 to 2.0<br />
Q37 Knowledge and ability of auditors 1,148 2.1 1.83 0.05 2.0 to 2.2 1.0 1.0 1.0 to 2.0<br />
Q38 Thoroughness of auditor 1,147 2.4 1.97 0.06 2.3 to 2.5 2.0 2.0 2.0 to 2.0<br />
Q39 Auditor understands my business 1,147 2.6 2.04 0.06 2.4 to 2.7 2.0 2.0 2.0 to 2.0<br />
Q40 Registrar’s response time to questions or concerns 1,140 3.0 2.25 0.07 2.9 to 3.1 2.0 3.0 2.0 to 2.0<br />
Q41 Consistency in standards interpretation and audit findings 1,137 2.6 2.12 0.06 2.5 to 2.8 2.0 2.0 2.0 to 2.0<br />
Q42 Value-added services 1,051 3.7 2.29 0.07 3.6 to 3.9 3.0 3.0 3.0 to 3.0<br />
Q43 Fast turnaround on reports 1,132 3.2 2.28 0.07 3.0 to 3.3 2.0 3.0 2.0 to 3.0<br />
Q44 Flexibility in scheduling 1,130 2.9 2.11 0.06 2.8 to 3.0 2.0 3.0 2.0 to 2.0<br />
26 <strong>Quality</strong> <strong>Digest</strong>/July 2004