- Page 1 and 2:
Wave Inversion Technology WIT Annua
- Page 3 and 4:
WIT Sponsors WIT Wave Inversion Tec
- Page 6:
with contributions from the WIT Gro
- Page 10:
Preface The third WIT (Wave-Inversi
- Page 13 and 14:
ii Vanelle C. and Gajewski D., Thre
- Page 15 and 16:
2 Müller and Shapiro extended the
- Page 17 and 18:
4 age data. Numerical results obtai
- Page 20 and 21:
Wave Inversion Technology, Report N
- Page 22 and 23:
9 t " ; t = ;() N R N ; R ! S R x
- Page 24 and 25:
11 1987), h B ( ~ M I )= 2 6 4 rT (
- Page 26 and 27:
13 200 (a) Time (ms) 250 300 350 40
- Page 28 and 29:
15 reflector, we can conceive its i
- Page 30 and 31:
Wave Inversion Technology, Report N
- Page 32 and 33:
19 0 X1 X2 X3 X4 Depth (m) 500 1000
- Page 34 and 35:
21 1 0 0.9 -0.05 0.8 -0.1 0.7 -0.15
- Page 36 and 37:
23 Interestingly enough, things do
- Page 38 and 39:
25 1 0 0.9 -0.05 0.8 -0.1 0.7 -0.15
- Page 40 and 41:
Wave Inversion Technology, Report N
- Page 42 and 43:
29 and x G = x m + h ; x o . The co
- Page 44 and 45:
31 SENSIBILITY ANALYSIS The most im
- Page 46 and 47:
33 CONCLUSIONS By using derivatives
- Page 48 and 49:
35 T 5 = T 6 = @ @ o = T 5 + T 6 (1
- Page 50: 37 0.8 Common−Offset Section (100
- Page 53 and 54: 40 INVERSION OF THE WAVEFIELD ATTRI
- Page 55 and 56: 42 X 0 α ~ α V 0 γ i (x ,z ) i i
- Page 57 and 58: 44 0 1 2 v = 1.5km/s 0 v = 4.5km/s
- Page 59 and 60: 46 second interface are slightly sc
- Page 61 and 62: 48 CONCLUSION We presented an inver
- Page 63 and 64: 50 .
- Page 66 and 67: Wave Inversion Technology, Report N
- Page 68 and 69: 55 time in respect to the start tim
- Page 70 and 71: 57 Figure 3: The same as Figure 2,
- Page 72 and 73: 59 By analogy with (2) we will look
- Page 74 and 75: 61 CONCLUSIONS We have developed a
- Page 76 and 77: Wave Inversion Technology, Report N
- Page 78 and 79: 65 will show later how the process
- Page 80 and 81: 67 and develops a series solution o
- Page 82 and 83: 69 For the 3-D case the results are
- Page 84 and 85: 71 0.3 0.2 relative fluctuations of
- Page 86 and 87: 73 It is now possible to describe s
- Page 88 and 89: 75 Pulse propagation in random medi
- Page 90 and 91: 77 Pulse propagation in random medi
- Page 92 and 93: Wave Inversion Technology, Report N
- Page 94 and 95: 81 The standard staggered grid A st
- Page 96 and 97: 83 EXPERIMENTAL SETUP As described
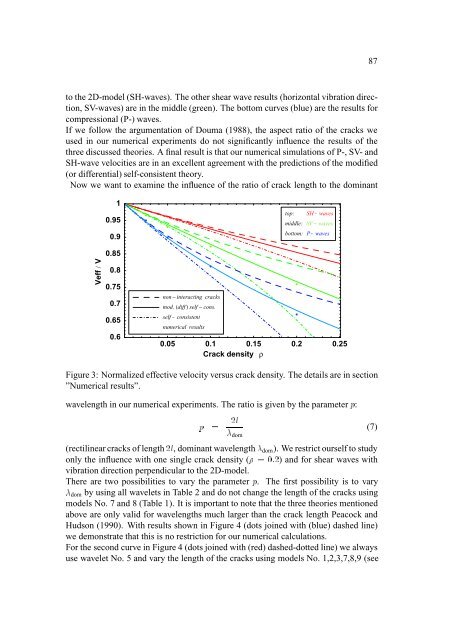
- Page 98 and 99: 85 0 0.04 0.08 0.12 0.16 depth (m)
- Page 102 and 103: 89 The first step to use this theor
- Page 104 and 105: 91 ACKNOWLEDGMENTS We wish to thank
- Page 106: Modeling 93
- Page 109 and 110: 96 are so small that the resulting
- Page 111 and 112: 98 zero. In other words, he sought
- Page 113 and 114: 100 We simulated a common-shot expe
- Page 115 and 116: 102 Relative error (%) 60 40 20 0
- Page 117 and 118: 104
- Page 119 and 120: 106 for the isotropic elastic case.
- Page 121 and 122: 108 of body forces, and with a Gree
- Page 123 and 124: 110 THE STATIONARY-PHASE APPROXIMAT
- Page 125 and 126: 112 Note that for each preassigned
- Page 127 and 128: 114
- Page 129 and 130: 116 3 s s s s x r r x s ~x 3
- Page 131 and 132: 118 Claim two The second claim to b
- Page 133 and 134: 120 Figure 2: Local Cartesian, ray
- Page 135 and 136: 122 Here, q and q denote the in-p
- Page 137 and 138: 124 Hubral, P., Schleicher, J., and
- Page 139 and 140: 126 and Gajewski, 1996; Vinje et al
- Page 141 and 142: 128 Figure 2: Wavefronts computed w
- Page 143 and 144: 130 source rays wavefront Figure 6:
- Page 145 and 146: 132 ACKNOWLEDGEMENTS This work was
- Page 147 and 148: 134 and Lecomte, 1992; Qin et al.,
- Page 149 and 150: 136 which is another form of snell'
- Page 151 and 152:
138 NUMERICAL TESTS The figures bel
- Page 153 and 154:
140 SUMMARY The following give the
- Page 155 and 156:
142
- Page 157 and 158:
144 on, e.g., the wavefront or refl
- Page 159 and 160:
146 Hubral et al. (1992) do a simil
- Page 161 and 162:
148 Depth [km] 0.2 0.4 0.6 0.8 0.2
- Page 163 and 164:
150 0.2 0.4 0.6 0.8 Y-Offset [km] 0
- Page 165 and 166:
152 and assume a linear relationshi
- Page 167 and 168:
154 the transformation ^Q = ^R T s
- Page 169 and 170:
156 rock have been generated by Joh
- Page 171 and 172:
158 Those latter coefficients descr
- Page 173 and 174:
160 (9) by explicit difference oper
- Page 175 and 176:
162 a series of large-amplitude sho
- Page 177 and 178:
164 CONCLUSIONS We have presented t
- Page 179 and 180:
166
- Page 181 and 182:
168 is slower than computing the fu
- Page 183 and 184:
170 Figure 1 shows the original 3D
- Page 185 and 186:
172 Figure 3: Snapshot of the elast
- Page 187 and 188:
174
- Page 189 and 190:
176 COMPUTING THE EFFECTIVE MEDIUM
- Page 191 and 192:
178 Vp [ km/s ] 4 3.8 3.6 3.4 3.2 3
- Page 193 and 194:
180 Figure 3: Time history of fluid
- Page 195 and 196:
182
- Page 197 and 198:
184 as salt body). To use full wave
- Page 199 and 200:
186 teristic change in subsurface p
- Page 201 and 202:
188
- Page 203 and 204:
190 CHEBYSHEV METHOD We use a Cheby
- Page 205 and 206:
192 x P 1 f (x) r P 4 P 2 f (x) r+1
- Page 207 and 208:
194 EXAMPLE In order to demonstrate
- Page 209 and 210:
196 CONCLUSION We developed a metho
- Page 211 and 212:
198
- Page 213 and 214:
200 The use of multi-parametric tra
- Page 215 and 216:
202 depending on the original and c
- Page 217 and 218:
204 (1999), the first part consists
- Page 219 and 220:
206 0 0.7 1 0.6 Zero offset travelt
- Page 221 and 222:
208 5 x 10⁻⁴ 0 First reflector N
- Page 223 and 224:
210 Müller, T., 1999, The common r
- Page 225 and 226:
212 with respect to the physical pr
- Page 227 and 228:
214 The problem under consideration
- Page 229 and 230:
216 0 B @ TI mudshale =0:034, =0:
- Page 231 and 232:
218 exact velocities for the horizo
- Page 233 and 234:
220 ACCURACY OF SECTORIAL APPROXIMA
- Page 235 and 236:
222 Sayers, C. M., 1994, P-wave pro
- Page 237 and 238:
224 The forward model used for the
- Page 239 and 240:
226 0.2 (a) 0.1 Amp(n) 0 −0.1 −
- Page 241 and 242:
228 1 1 P(x,t) 0.5 P(x,t) 0.5 0 0 1
- Page 243 and 244:
230 KALMAN - WIENER The integral eq
- Page 245 and 246:
232 (2) Definition of the state vec
- Page 247 and 248:
234 0.2 0.15 0.1 0.05 Amp(n) 0 −0
- Page 249 and 250:
236 0 0 0 100 100 100 200 200 200 3
- Page 251 and 252:
238 Mendel, J., Nashi, N., and Chan
- Page 253 and 254:
240 One of the first methods which
- Page 255 and 256:
242 a limited time range while the
- Page 257 and 258:
244 Offset (km) 0.5 1.5 2.5 Figure
- Page 259 and 260:
246 where u 0 j is the conjugate tr
- Page 261 and 262:
248 CONCLUSION Coherency analysis o
- Page 263 and 264:
250 Montgomery, D. C., and Runger,
- Page 265 and 266:
252
- Page 267 and 268:
254 2. 3. 4. Macromodel determinati
- Page 269 and 270:
256 Research students: Ingo Koglin
- Page 271 and 272:
258 João Luis Martins Migration an
- Page 273 and 274:
260
- Page 275 and 276:
262 Elf Exploration UK plc 30 Bucki
- Page 277 and 278:
264 PGS Seres AS P.O. Box 354 Stran
- Page 279 and 280:
266 Robert Essenreiter received his
- Page 281 and 282:
268 L.W.B. Leite Professor of Geoph
- Page 283 and 284:
270 Melanie Pohl is dealing with wa
- Page 285 and 286:
272 The first two years of this tim
- Page 287:
274 scientist in Karlsruhe and at C


