<strong>RACING</strong> STATISTICS Table 1. <strong>Australian</strong> <strong>Racing</strong> Statistics, State by State 2009/10 NSW VIC QLD SA WA TAS NT ACT AUSTRALIA Clubs 121 66 118 24 34 4 6 1 374 Tracks 112 72 105 23 34 6 6 2 360 Race meetings 747 567 718 188 296 73 79 26 2,694 Flat Races 5,323 4,405 4,701 1,404 2,224 594 433 197 19,281 Jumping 0 67 0 28 0 0 0 0 95 Total Races 5,323 4,472 4,701 1,432 2,224 594 433 197 19,376 Flat Horses 10,924 8,942 8,152 3,036 3,989 1,077 621 1,079 31,574 Jumping Horses 0 164 0 91 0 0 0 0 199 Total Horses# 10,924 9,106 8,152 3,127 3,989 1,077 621 1,079 31,773 Flat Starters 55,081 43,676 46,311 14,170 23,290 5,893 3,515 2,070 194,006 Jumping Starters 0 489 0 241 0 0 0 0 730 Total Starters 55,081 44,165 46,311 14,411 23,290 5,893 3,515 2,070 194,736 prizemoney $113,551,000 $141,315,700 $78,111,030 $26,748,450 $48,924,991 $9,838,200 $5,628,400 $3,128,000 $427,245,771 Incentive Scheme payouts ($) $9,073,810 $5,901,295 $5,376,200 $1,788,275 $3,082,500 $391,100 $235,000 $0 $25,848,180 Other Returns to Owners $19,248,649 $13,837,676 $19,509,039 $1,858,855 $4,076,838 $1,528,309 $1,056,941 $674,127 $61,790,434 Subtotal Returns to Owners (+) $141,873,459 $161,054,671 $102,996,269 $30,395,580 $56,084,329 $11,757,609 $6,920,341 $3,802,127 $514,884,385 Fees paid By Owners (-) $7,978,462 $10,906,317 $9,285,500 $2,039,160 $1,765,276 $518,224 $958,838 $109,705 $33,561,482 Total Returns to Owners $133,894,997 $150,148,354 $93,710,769 $28,356,420 $54,319,053 $11,239,385 $5,961,503 $3,692,422 $481,322,903 Bookmakers 203 146 107 38 56 18 50 13 631 Trainers 1,027 657 947 193 689 99 33 23 3,668 Owner/Trainers 116 452 125 138 31 18 6 0 886 Total Trainers 1,143 1,109 1,072 331 720 117 39 23 4,554 Jockeys 152 148 197 36 59 19 27 * 638 Apprentice Jockeys 99 37 62 16 32 9 4 * 259 Amateur Jockeys 32 34 14 0 27 0 0 * 107 Total Riders 283 219 273 52 118 28 31 0 1,004 *ACT Jockeys were counted in NSW # The Total <strong>Australian</strong> Horses figure does not include the 6302 horses that started in more than 1 state Other Returns to Owners include starters rebates, appearance fees, float rebates, fess paid on behalf of owners etc Fees paid by owners include, nominations, acceptances, bonus scheme registration Table 2. Statistics by TAB Coverage, State by State 2009/10 NSW VIC QLD SA WA TAS NT ACT AUSTRALIA TAB meetings 572 490 410 175 225 72 76 23 2,043 Non TAB meetings 175 77 308 13 71 1 3 3 651 TAB Races 4,452 3,991 3,133 1357 1,782 587 417 177 15,896 Non Tab Races 931 481 1,568 75 442 7 16 20 3,540 TAB Starts 47,280 40,787 33,322 13,783 19,843 5,812 3,435 1,891 166,153 Non Tab Starts 7,801 3,378 12,989 628 3,447 81 80 179 28,583 Additional <strong>Racing</strong> information and Statistics can be sourced from RISA (www.risa.com.au) 12 www.australianracingboard.com.au
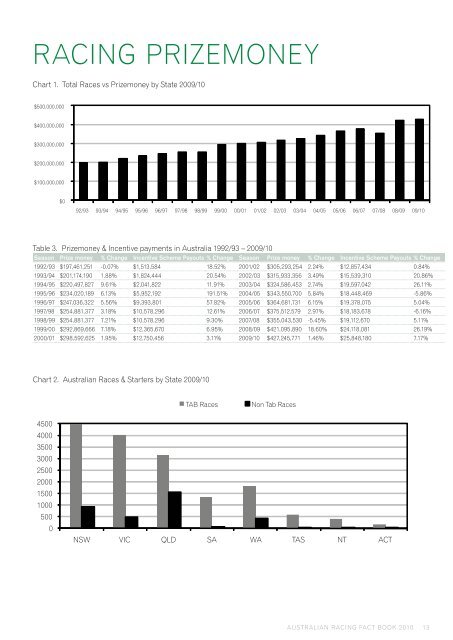
<strong>RACING</strong> pRIzEmONEY New Chart 1 Total Races vs Prizemoney by State 2009/10 (page 13) Chart 1. Total Races vs prizemoney by State 2009/10Prizemoney $500,000,000 $400,000,000 $300,000,000 $200,000,000 $100,000,000 New Chart 1 Total Races vs Prizemoney by State 2009/10 (page 13) Prizemoney CHART 9 Stakes and Standard Race Prizemoney 1999/2000 - 2009/10 (page 51) $500,000,000 Table 3. prizemoney & Incentive payments in Australia 1992/93 – 2009/10 Season Prize money % Change Incentive Scheme Stakes Race Payouts Prizemoney % Change Season Standard Race Prize Prizemoney money % Change Total Incentive Prizemoney Scheme Payouts % Change $400,000,000 1992/93 $197,461,251 -0.07% $1,513,584 18.52% 2001/02 $305,293,254 2.24% $12,857,434 0.84% 1993/94 $201,174,190 1.88% $1,824,444 20.54% 2002/03 $315,933,356 3.49% $15,539,310 20.86% $300,000,000 $400,000,000 1994/95 $220,497,827 9.61% $2,041,822 11.91% 2003/04 $324,586,453 2.74% $19,597,042 26.11% 1995/96 $234,020,189 6.13% $5,952,192 191.51% 2004/05 $343,550,700 5.84% $18,448,469 -5.86% $200,000,000 1996/97 $247,036,322 5.56% $9,393,801 57.82% 2005/06 $364,681,731 6.15% $19,378,075 5.04% 1997/98 $254,881,377 3.18% $10,578,296 12.61% 2006/07 $375,512,579 2.97% $18,183,678 -6.16% $100,000,000 $250,000,000 1998/99 $254,881,377 7.21% $10,578,296 9.30% 2007/08 $355,043,530 -5.45% $19,112,670 5.11% 1999/00 $292,869,666 7.18% $12,365,670 6.95% 2008/09 $421,095,890 18.60% $24,118,081 26.19% $0 2000/01 $298,592,625$150,000,000 1.95% $12,750,456 3.11% 2009/10 $427,245,771 1.46% $25,848,180 7.17% 92/93 93/94 94/95 95/96 96/97 97/98 98/99 99/00 00/01 01/02 02/03 03/04 04/05 05/06 06/07 07/08 08/09 09/10 Chart 1 <strong>Australian</strong> races & starters by State 2009/10 (page13) Chart 2. <strong>Australian</strong> Races & Starters by State 2009/10 80 70 60 4500 4000 3500 3000 2500 2000 1500 1000 500 0 $0 92/93 93/94 94/95 95/96 96/97 97/98 98/99 99/00 00/01 01/02 02/03 03/04 04/05 05/06 06/07 07/08 08/09 09/10 Prizemoney (M$) $450,000,000 $350,000,000 $300,000,000 $200,000,000 $100,000,000 $50,000,000 $0 99/00 00/01 01/02 02/03 03/04 04/05 05/06 06/07 07/08 08/09 09/10 CHART 9 Stakes and Standard Race Prizemoney 1999/2000 - 2009/10 (page 51) TAB Races Non Tab Races Prizemoney (M$) $450,000,000 $400,000,000 $350,000,000 $300,000,000 $250,000,000 $200,000,000 $150,000,000 $100,000,000 $50,000,000 NSW VIC QLD SA WA TAS NT ACT $0 Stakes Race Prizemoney Standard Race Prizemoney Total Prizemoney 99/00 00/01 01/02 02/03 03/04 04/05 05/06 06/07 07/08 08/09 09/10 Chart 2 Black Type Races by State (page15) Group 1 Races Group 2 Races Group 3 Races Listed Races <strong>AUSTRALIAN</strong> <strong>RACING</strong> FACT BOOK 2010 13
- Page 1 and 2: AUSTRALIAN RACING FACT BOOK 2010 A
- Page 3 and 4: AUSTRALIAN RACING FACT BOOK 2010 3
- Page 5 and 6: AUSTRALIAN RACING FACT BOOK 2010 A
- Page 7 and 8: CONTENTS 8 AUSTRALIAN RACING STRUCT
- Page 9 and 10: RACING STRUCTURE mAJOR RACE CLUBS A
- Page 11: KEY FACTS Race Clubs 374 Tracks 360
- Page 15 and 16: $500,000,000 $400,000,000 GROUp & L
- Page 17 and 18: pRIzEmONEY EARNERS Table 8. Top 10
- Page 19 and 20: RACE HORSE OF THE YEAR The awards n
- Page 21 and 22: Table 12. Emirates melbourne Cup Fi
- Page 23 and 24: Table 14. AAmI Golden Slipper Field
- Page 25 and 26: Table 18. Leading Group Race Jockey
- Page 27 and 28: Distance Time Randwick Date 1,000m
- Page 29 and 30: KEY FACTS Stallions 824 Mares Retur
- Page 31 and 32: FOAL & mARE, COURTESY OF KATRINA pA
- Page 33 and 34: Table 24. Stallion Distribution by
- Page 35 and 36: Table 29. Leading Australian Sires
- Page 37 and 38: Table 32. Australian Sires by Servi
- Page 39 and 40: KEY FACTS Males Registered 6,575 Fe
- Page 41 and 42: Chart 7. Registrations by Sex 2001/
- Page 43 and 44: KEY FACTS Weanlings Sold 1,147 Year
- Page 45 and 46: Table 43. Yearling Sales Results 19
- Page 47 and 48: ExpORTS Table 47. Exported and Impo
- Page 49 and 50: KEY FACTS Race meetings 2,694 Races
- Page 51 and 52: New Chart 1 Total Races vs Prizemon
- Page 53 and 54: Table 57. Horses by Number of Wins
- Page 55 and 56: KEY FACTS Champion Rated Horse So Y
- Page 57 and 58: CLASSIFICATIONS Table 62. Australia
- Page 59 and 60: CLASSIFICATIONS Table 69. Highest R
- Page 61 and 62: KEY FACTS TAB Thoroughbred Wagering
- Page 63 and 64:
TURNOVER Table 74. New South Wales
- Page 65 and 66:
WAGERING TURNOVER Table 80. ACT Tho
- Page 67 and 68:
OTHER FORmS OF GAmBLING Table 84. G
- Page 69 and 70:
PARI-MUTUEL BET TYPES Table 88. All
- Page 71 and 72:
AUSTRALIAN RACING FACT BOOK 2010 71
- Page 73 and 74:
INTERNATIONAL pRIzEmONEY Table 93.
- Page 75 and 76:
FOAL, COURTESY OF KATRINA pARTRIDGE
- Page 77 and 78:
Table 97. Worldwide Overall Starts
- Page 79 and 80:
AUSTRALIAN RACING FACT BOOK 2010 79
- Page 81 and 82:
THOROUGHBRED BREEDERS AUSTRALIA AUS
- Page 83 and 84:
OFFICE OF LIQUOR, GAmING AND RACING
- Page 85 and 86:
S O U T H A U S T R A L I A PRINCIP
- Page 87 and 88:
TAB TOTE TASmANIA Chief Executive O
- Page 89 and 90:
WA BOOKmAKERS ASSOCIATION INC. pres
- Page 91 and 92:
AUSTRALIAN RACING FACT BOOK 2010 91
- Page 93 and 94:
CANADA THE JOCKEY CLUB OF CANADA p
- Page 95 and 96:
mADAGASCAR AUTORITé HIppIQUE pOUR
- Page 97 and 98:
SWEDEN THE SWEDISH JOCKEY CLUB SWIT
- Page 99:
AUSTRALIAN RACING FACT BOOK 2010 99