Professional and progressive - Society of Radiographers
Professional and progressive - Society of Radiographers
Professional and progressive - Society of Radiographers

You also want an ePaper? Increase the reach of your titles
YUMPU automatically turns print PDFs into web optimized ePapers that Google loves.
SOCIETY AND COLLEGE OF RADIOGRAPHERS<br />
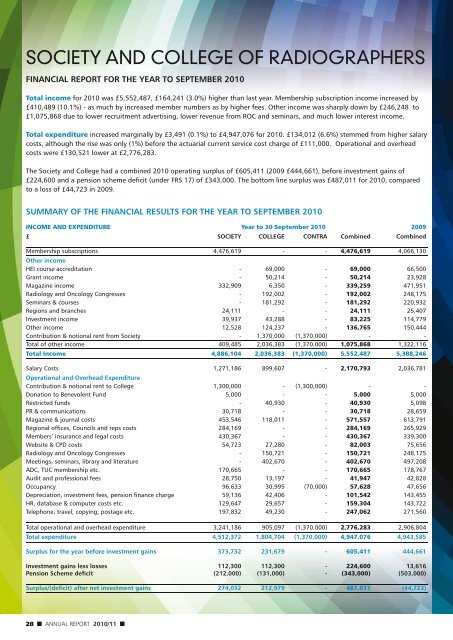
FINANCIAL REPORT FOR THE YEAR TO SEPTEMBER 2010<br />
Total income for 2010 was £5,552,487, £164,241 (3.0%) higher than last year. Membership subscription income increased by<br />
£410,489 (10.1%) - as much by increased member numbers as by higher fees. Other income was sharply down by £246,248 to<br />
£1,075,868 due to lower recruitment advertising, lower revenue from ROC <strong>and</strong> seminars, <strong>and</strong> much lower interest income.<br />
Total expenditure increased marginally by £3,491 (0.1%) to £4,947,076 for 2010. £134,012 (6.6%) stemmed from higher salary<br />
costs, although the rise was only (1%) before the actuarial current service cost charge <strong>of</strong> £111,000. Operational <strong>and</strong> overhead<br />
costs were £130,521 lower at £2,776,283.<br />
The <strong>Society</strong> <strong>and</strong> College had a combined 2010 operating surplus <strong>of</strong> £605,411 (2009 £444,661), before investment gains <strong>of</strong><br />
£224,600 <strong>and</strong> a pension scheme deficit (under FRS 17) <strong>of</strong> £343,000. The bottom line surplus was £487,011 for 2010, compared<br />
to a loss <strong>of</strong> £44,723 in 2009.<br />
SUMMARY OF THE FINANCIAL RESULTS FOR THE YEAR TO SEPTEMBER 2010<br />
INCOME AND EXPENDITURE Year to 30 September 2010 2009<br />
£ SOCIETY COLLEGE CONTRA Combined Combined<br />
Membership subscriptions 4,476,619 - - 4,476,619 4,066,130<br />
Other income<br />
HEI course accreditation - 69,000 - 69,000 66,500<br />
Grant income - 50,214 - 50,214 23,928<br />
Magazine income 332,909 6,350 - 339,259 471,951<br />
Radiology <strong>and</strong> Oncology Congresses - 192,002 - 192,002 248,175<br />
Seminars & courses - 181,292 - 181,292 220,932<br />
Regions <strong>and</strong> branches 24,111 - - 24,111 25,407<br />
Investment income 39,937 43,288 - 83,225 114,779<br />
Other income 12,528 124,237 - 136,765 150,444<br />
Contribution & notional rent from <strong>Society</strong> - 1,370,000 (1,370,000) - -<br />
Total <strong>of</strong> other income 409,485 2,036,383 (1,370,000) 1,075,868 1,322,116<br />
Total Income 4,886,104 2,036,383 (1,370,000) 5,552,487 5,388,246<br />
Salary Costs 1,271,186 899,607 - 2,170,793 2,036,781<br />
Operational <strong>and</strong> Overhead Expenditure<br />
Contribution & notional rent to College 1,300,000 - (1,300,000) - -<br />
Donation to Benevolent Fund 5,000 - - 5,000 5,000<br />
Restricted funds - 40,930 - 40,930 5,098<br />
PR & communications 30,718 - - 30,718 28,659<br />
Magazine & journal costs 453,546 118,011 - 571,557 613,791<br />
Regional <strong>of</strong>fices, Councils <strong>and</strong> reps costs 284,169 - - 284,169 265,929<br />
Members’ insurance <strong>and</strong> legal costs 430,367 - - 430,367 339,300<br />
Website & CPD costs 54,723 27,280 - 82,003 75,656<br />
Radiology <strong>and</strong> Oncology Congresses - 150,721 - 150,721 248,175<br />
Meetings, seminars, library <strong>and</strong> literature - 402,670 - 402,670 497,208<br />
ADC, TUC membership etc. 170,665 - - 170,665 178,767<br />
Audit <strong>and</strong> pr<strong>of</strong>essional fees 28,750 13,197 - 41,947 42,828<br />
Occupancy 96,633 30,995 (70,000) 57,628 47,656<br />
Depreciation, investment fees, pension finance charge 59,136 42,406 - 101,542 143,455<br />
HR, database & computer costs etc. 129,647 29,657 - 159,304 143,722<br />
Telephone, travel, copying, postage etc. 197,832 49,230 - 247,062 271,560<br />
Total operational <strong>and</strong> overhead expenditure 3,241,186 905,097 (1,370,000) 2,776,283 2,906,804<br />
Total expenditure 4,512,372 1,804,704 (1,370,000) 4,947,076 4,943,585<br />
Surplus for the year before investment gains 373,732 231,679 - 605,411 444,661<br />
Investment gains less losses 112,300 112,300 - 224,600 13,616<br />
Pension Scheme deficit (212,000) (131,000) - (343,000) (503,000)<br />
Surplus/(deficit) after net investment gains 274,032 212,979 - 487,011 (44,723)<br />
28 ANNUAL REPORT 2010/11