The economic effecTs of RighT-To-WoRK LaWs ... - Mackinac Center
The economic effecTs of RighT-To-WoRK LaWs ... - Mackinac Center
The economic effecTs of RighT-To-WoRK LaWs ... - Mackinac Center

You also want an ePaper? Increase the reach of your titles
YUMPU automatically turns print PDFs into web optimized ePapers that Google loves.
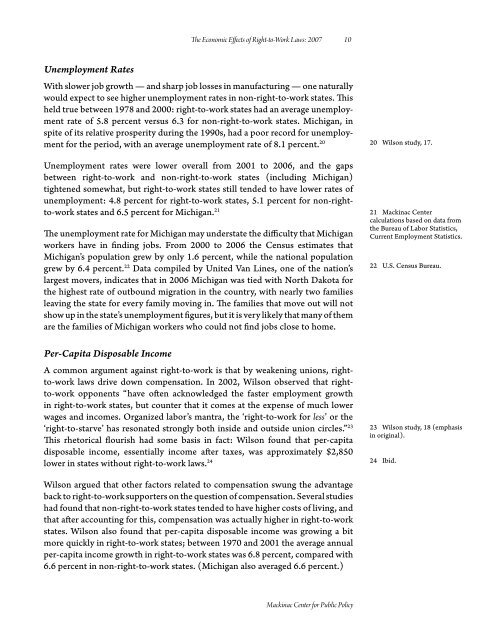
<strong>The</strong> Economic Effects <strong>of</strong> Right-to-Work Laws: 2007 10<br />
Unemployment Rates<br />
With slower job growth — and sharp job losses in manufacturing — one naturally<br />
would expect to see higher unemployment rates in non-right-to-work states. This<br />
held true between 1978 and 2000: right-to-work states had an average unemployment<br />
rate <strong>of</strong> 5.8 percent versus 6.3 for non-right-to-work states. Michigan, in<br />
spite <strong>of</strong> its relative prosperity during the 1990s, had a poor record for unemployment<br />
for the period, with an average unemployment rate <strong>of</strong> 8.1 percent. 20<br />
Unemployment rates were lower overall from 2001 to 2006, and the gaps<br />
between right-to-work and non-right-to-work states (including Michigan)<br />
tightened somewhat, but right-to-work states still tended to have lower rates <strong>of</strong><br />
unemployment: 4.8 percent for right-to-work states, 5.1 percent for non-rightto-work<br />
states and 6.5 percent for Michigan. 21<br />
<strong>The</strong> unemployment rate for Michigan may understate the difficulty that Michigan<br />
workers have in finding jobs. From 2000 to 2006 the Census estimates that<br />
Michigan’s population grew by only 1.6 percent, while the national population<br />
grew by 6.4 percent. 22 Data compiled by United Van Lines, one <strong>of</strong> the nation’s<br />
largest movers, indicates that in 2006 Michigan was tied with North Dakota for<br />
the highest rate <strong>of</strong> outbound migration in the country, with nearly two families<br />
leaving the state for every family moving in. <strong>The</strong> families that move out will not<br />
show up in the state’s unemployment figures, but it is very likely that many <strong>of</strong> them<br />
are the families <strong>of</strong> Michigan workers who could not find jobs close to home.<br />
Per-Capita Disposable Income<br />
A common argument against right-to-work is that by weakening unions, rightto-work<br />
laws drive down compensation. In 2002, Wilson observed that rightto-work<br />
opponents “have <strong>of</strong>ten acknowledged the faster employment growth<br />
in right-to-work states, but counter that it comes at the expense <strong>of</strong> much lower<br />
wages and incomes. Organized labor’s mantra, the ‘right-to-work for less’ or the<br />
‘right-to-starve’ has resonated strongly both inside and outside union circles.” 23<br />
This rhetorical flourish had some basis in fact: Wilson found that per-capita<br />
disposable income, essentially income after taxes, was approximately $2,850<br />
lower in states without right-to-work laws. 24<br />
20 Wilson study, 17.<br />
21 <strong>Mackinac</strong> <strong>Center</strong><br />
calculations based on data from<br />
the Bureau <strong>of</strong> Labor Statistics,<br />
Current Employment Statistics.<br />
22 U.S. Census Bureau.<br />
23 Wilson study, 18 (emphasis<br />
in original).<br />
24 Ibid.<br />
Wilson argued that other factors related to compensation swung the advantage<br />
back to right-to-work supporters on the question <strong>of</strong> compensation. Several studies<br />
had found that non-right-to-work states tended to have higher costs <strong>of</strong> living, and<br />
that after accounting for this, compensation was actually higher in right-to-work<br />
states. Wilson also found that per-capita disposable income was growing a bit<br />
more quickly in right-to-work states; between 1970 and 2001 the average annual<br />
per-capita income growth in right-to-work states was 6.8 percent, compared with<br />
6.6 percent in non-right-to-work states. (Michigan also averaged 6.6 percent.)<br />
<strong>Mackinac</strong> <strong>Center</strong> for Public Policy