MORENO BEACH PLAZA - City of Moreno Valley
MORENO BEACH PLAZA - City of Moreno Valley
MORENO BEACH PLAZA - City of Moreno Valley

Create successful ePaper yourself
Turn your PDF publications into a flip-book with our unique Google optimized e-Paper software.
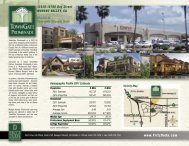
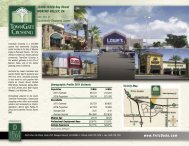
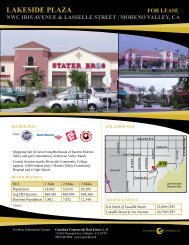
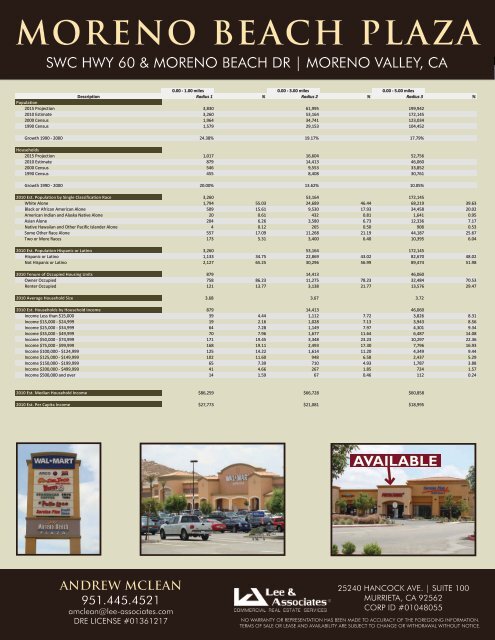
<strong>MORENO</strong> <strong>BEACH</strong> <strong>PLAZA</strong><br />
SWC HWY 60 & <strong>MORENO</strong> <strong>BEACH</strong> DR | <strong>MORENO</strong> VALLEY, CA<br />
0.00 ‐ 1.00 miles 0.00 ‐ 3.00 miles 0.00 ‐ 5.00 miles<br />
Description Radius 1 % Radius 2 % Radius 3 %<br />
Population<br />
2015 Projection 3,830 61,995 199,942<br />
2010 Estimate 3,260 53,164 172,145<br />
2000 Census 1,964 34,741 123,034<br />
1990 Census 1,579 29,153 104,452<br />
Growth 1990 ‐ 2000 24.38% 19.17% 17.79%<br />
Households<br />
2015 Projection 1,017 16,604 52,756<br />
2010 Estimate 879 14,413 46,060<br />
2000 Census 546 9,553 33,852<br />
1990 Census 455 8,408 30,761<br />
Growth 1990 ‐ 2000 20.00% 13.62% 10.05%<br />
2010 Est. Population by Single Classification Race 3,260 53,164 172,145<br />
White Alone 1,794 55.03 24,689 46.44 68,219 39.63<br />
Black or African American Alone 509 15.61 9,530 17.93 34,458 20.02<br />
American Indian and Alaska Native Alone 20 0.61 432 0.81 1,641 0.95<br />
Asian Alone 204 6.26 3,580 6.73 12,336 7.17<br />
Native Hawaiian and Other Pacific Islander Alone 4 0.12 265 0.50 908 0.53<br />
Some Other Race Alone 557 17.09 11,268 21.19 44,187 25.67<br />
Two or More Races 173 5.31 3,400 6.40 10,395 6.04<br />
2010 Est. Population Hispanic or Latino 3,260 53,164 172,145<br />
Hispanic or Latino 1,133 34.75 22,869 43.02 82,670 48.02<br />
Not Hispanic or Latino 2,127 65.25 30,296 56.99 89,474 51.98<br />
2010 Tenure <strong>of</strong> Occupied Housing Units 879 14,413 46,060<br />
Owner Occupied 758 86.23 11,275 78.23 32,484 70.53<br />
Renter Occupied 121 13.77 3,138 21.77 13,576 29.47<br />
2010 Average Household Size 3.68 3.67 3.72<br />
2010 Est. Households by Household Income 879 14,413 46,060<br />
Income Less than $15,000 39 4.44 1,112 7.72 3,826 8.31<br />
Income $15,000 ‐ $24,999 19 2.16 1,028 7.13 3,943 8.56<br />
Income $25,000 ‐ $34,999 64 7.28 1,149 7.97 4,301 9.34<br />
Income $35,000 ‐ $49,999 70 7.96 1,677 11.64 6,487 14.08<br />
Income $50,000 ‐ $74,999 171 19.45 3,348 23.23 10,297 22.36<br />
Income $75,000 ‐ $99,999 168 19.11 2,493 17.30 7,796 16.93<br />
Income $100,000 ‐ $124,999 125 14.22 1,614 11.20 4,349 9.44<br />
Income $125,000 ‐ $149,999 102 11.60 948 6.58 2,437 5.29<br />
Income $150,000 ‐ $199,999 65 7.39 710 4.93 1,787 3.88<br />
Income $200,000 ‐ $499,999 41 4.66 267 1.85 724 1.57<br />
Income $500,000 and over 14 1.59 67 0.46 112 0.24<br />
2010 Est. Median Household Income $86,259 $66,728 $60,858<br />
2010 Est. Per Capita Income $27,773 $21,081 $18,995<br />
AVAILABLE<br />
ANDREW MCLEAN<br />
951.445.4521<br />
amclean@lee-associates.com<br />
DRE LICENSE #01361217<br />
25240 HANCOCK AVE. | SUITE 100<br />
MURRIETA, CA 92562<br />
CORP ID #01048055<br />
NO WARRANTY OR REPRESENTATION HAS BEEN MADE TO ACCURACY OF THE FOREGOING INFORMATION.<br />
TERMS OF SALE OR LEASE AND AVAILABILITY ARE SUBJECT TO CHANGE OR WITHDRAWAL WITHOUT NOTICE.