Surveying roaming dog populations: guidelines ... - Animal Sheltering
Surveying roaming dog populations: guidelines ... - Animal Sheltering
Surveying roaming dog populations: guidelines ... - Animal Sheltering

Create successful ePaper yourself
Turn your PDF publications into a flip-book with our unique Google optimized e-Paper software.
From indicator counts to evaluation<br />
Indicator counts should be relatively quick to complete and could therefore be conducted several times<br />
within a year. However, as breeding in <strong>roaming</strong> <strong>dog</strong>s is often seasonal, the number of <strong>dog</strong>s on the street<br />
is bound to change during the year. Hence, for evaluation, it is necessary to compare indicator counts<br />
taken at the same time of year; so if only a single indicator count is conducted per year, this should<br />
always be at the same time of year. A count approximately six weeks after most of the pups are born<br />
(peak time of ‘whelping’) might be the most valuable as this is when the number of pups visible outside<br />
the ‘den’ will be high. At this time the pups from the current year’s breeding season can be easily<br />
distinguished from <strong>dog</strong>s at or over a year old produced in previous breeding seasons. The percentage of<br />
lactating females during the breeding season also provides a relatively sensitive indicator of the effect of<br />
an intervention aiming to change the reproductive capacity of <strong>dog</strong> <strong>populations</strong>.<br />
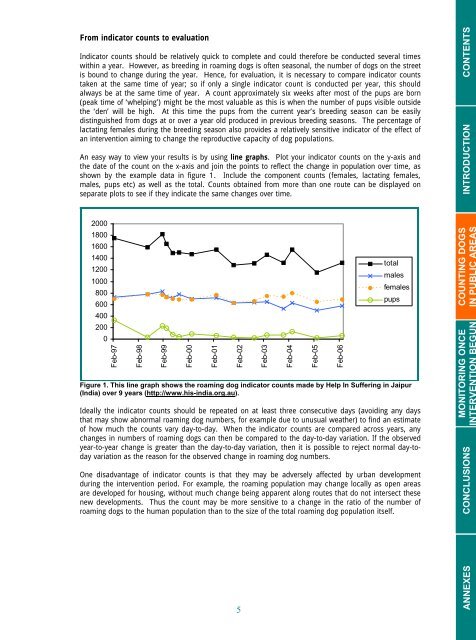
An easy way to view your results is by using line graphs. Plot your indicator counts on the y-axis and<br />
the date of the count on the x-axis and join the points to reflect the change in population over time, as<br />
shown by the example data in figure 1. Include the component counts (females, lactating females,<br />
males, pups etc) as well as the total. Counts obtained from more than one route can be displayed on<br />
separate plots to see if they indicate the same changes over time.<br />
CONTENTS<br />
INTRODUCTION<br />
2000<br />
1800<br />
1600<br />
1400<br />
1200<br />
1000<br />
800<br />
600<br />
400<br />
200<br />
0<br />
Feb-97<br />
Feb-98<br />
Feb-99<br />
Feb-00<br />
Feb-01<br />
Feb-02<br />
Feb-03<br />
Feb-04<br />
Feb-05<br />
Feb-06<br />
total<br />
males<br />
females<br />
Figure 1. This line graph shows the <strong>roaming</strong> <strong>dog</strong> indicator counts made by Help In Suffering in Jaipur<br />
(India) over 9 years (http://www.his-india.org.au).<br />
Ideally the indicator counts should be repeated on at least three consecutive days (avoiding any days<br />
that may show abnormal <strong>roaming</strong> <strong>dog</strong> numbers, for example due to unusual weather) to find an estimate<br />
of how much the counts vary day-to-day. When the indicator counts are compared across years, any<br />
changes in numbers of <strong>roaming</strong> <strong>dog</strong>s can then be compared to the day-to-day variation. If the observed<br />
year-to-year change is greater than the day-to-day variation, then it is possible to reject normal day-today<br />
variation as the reason for the observed change in <strong>roaming</strong> <strong>dog</strong> numbers.<br />
One disadvantage of indicator counts is that they may be adversely affected by urban development<br />
during the intervention period. For example, the <strong>roaming</strong> population may change locally as open areas<br />
are developed for housing, without much change being apparent along routes that do not intersect these<br />
new developments. Thus the count may be more sensitive to a change in the ratio of the number of<br />
<strong>roaming</strong> <strong>dog</strong>s to the human population than to the size of the total <strong>roaming</strong> <strong>dog</strong> population itself.<br />
pups<br />
COUNTING DOGS<br />
MONITORING ONCE<br />
CONCLUSIONS<br />
5<br />
ANNEXES