involvement of women and minorities in the urban forestry ... - TreeLink
involvement of women and minorities in the urban forestry ... - TreeLink
involvement of women and minorities in the urban forestry ... - TreeLink

Create successful ePaper yourself
Turn your PDF publications into a flip-book with our unique Google optimized e-Paper software.
30 Kuhns et al.: Women <strong>and</strong> M<strong>in</strong>orities <strong>in</strong> Urban Forestry<br />
ans comprised 0.4% <strong>of</strong> our respondents <strong>and</strong> 0.6% <strong>of</strong> <strong>the</strong><br />
labor force (<strong>in</strong> 1990) (U.S. Census Bureau 1998).<br />
Prevalence <strong>of</strong> females <strong>and</strong> <strong>m<strong>in</strong>orities</strong> varied little between<br />
ISA <strong>and</strong> SAF respondents but was quite different<br />
for state/volunteer coord<strong>in</strong>ators. N<strong>in</strong>e percent <strong>of</strong> ISA <strong>and</strong><br />
10% <strong>of</strong> SAF respondents were female, <strong>and</strong> 5% <strong>of</strong> ISA <strong>and</strong><br />
6% <strong>of</strong> SAF respondents were <strong>m<strong>in</strong>orities</strong>. In contrast, 40%<br />
<strong>of</strong> state/volunteer coord<strong>in</strong>ators were female, <strong>and</strong> only 3%<br />
(n = 2) were <strong>m<strong>in</strong>orities</strong>. State/volunteer coord<strong>in</strong>ators are<br />
persons hired by state <strong>forestry</strong> agencies or affiliated groups<br />
<strong>and</strong> funded by state <strong>and</strong>/or federal funds to coord<strong>in</strong>ate<br />
state <strong>urban</strong> <strong>forestry</strong> <strong>and</strong> volunteer-based <strong>urban</strong> tree programs.<br />
This state government connection may partly expla<strong>in</strong><br />
<strong>the</strong> high female percentage for state/volunteer<br />
coord<strong>in</strong>ators. Affirmative action programs have been quite<br />
effective at <strong>in</strong>creas<strong>in</strong>g <strong>the</strong> hir<strong>in</strong>g <strong>of</strong> <strong>women</strong> <strong>and</strong> <strong>m<strong>in</strong>orities</strong><br />
<strong>in</strong> <strong>the</strong> public sector (Naff 1994). The low proportion<br />
<strong>of</strong> <strong>m<strong>in</strong>orities</strong> <strong>in</strong> coord<strong>in</strong>ator positions is difficult to expla<strong>in</strong>,<br />
though most would be required to have a college<br />
degree, <strong>and</strong> only three m<strong>in</strong>ority students received <strong>urban</strong><br />
<strong>forestry</strong> bachelor’s degrees between 1988 <strong>and</strong> 1997. However,<br />
103 <strong>m<strong>in</strong>orities</strong> received general <strong>forestry</strong> B.S. degrees<br />
<strong>in</strong> 1996 (FAEIS 1999b), so m<strong>in</strong>ority graduates presumably<br />
are available.<br />
Age, Experience, <strong>and</strong> Income<br />
Women were younger <strong>and</strong> had less time <strong>in</strong> <strong>the</strong> pr<strong>of</strong>ession<br />
than <strong>the</strong>ir white male counterparts, with <strong>m<strong>in</strong>orities</strong> <strong>in</strong>termediate<br />
<strong>in</strong> age <strong>and</strong> time <strong>in</strong> <strong>the</strong> pr<strong>of</strong>ession. White males<br />
averaged 46 years old, <strong>m<strong>in</strong>orities</strong> 44 years, females 41<br />
years, <strong>and</strong> female <strong>m<strong>in</strong>orities</strong> 42 years. Time <strong>in</strong> <strong>the</strong> pr<strong>of</strong>ession<br />
averaged 19 years for white males, 16 years for <strong>m<strong>in</strong>orities</strong>,<br />
11 years for females, <strong>and</strong> 13 years for female<br />
<strong>m<strong>in</strong>orities</strong>.<br />
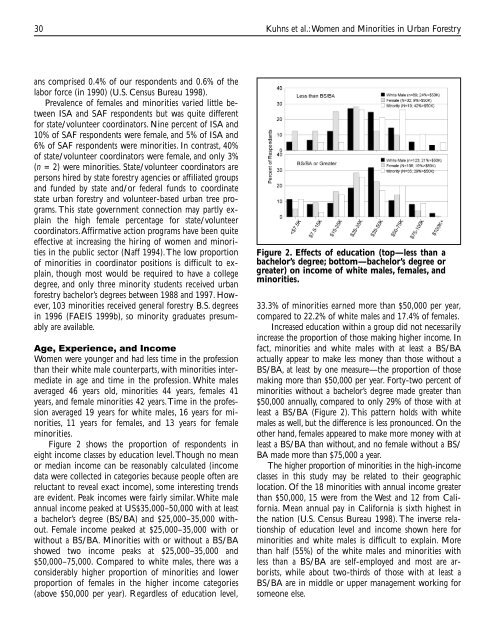
Figure 2 shows <strong>the</strong> proportion <strong>of</strong> respondents <strong>in</strong><br />
eight <strong>in</strong>come classes by education level. Though no mean<br />
or median <strong>in</strong>come can be reasonably calculated (<strong>in</strong>come<br />
data were collected <strong>in</strong> categories because people <strong>of</strong>ten are<br />
reluctant to reveal exact <strong>in</strong>come), some <strong>in</strong>terest<strong>in</strong>g trends<br />
are evident. Peak <strong>in</strong>comes were fairly similar. White male<br />
annual <strong>in</strong>come peaked at US$35,000–50,000 with at least<br />
a bachelor’s degree (BS/BA) <strong>and</strong> $25,000–35,000 without.<br />
Female <strong>in</strong>come peaked at $25,000–35,000 with or<br />
without a BS/BA. M<strong>in</strong>orities with or without a BS/BA<br />
showed two <strong>in</strong>come peaks at $25,000–35,000 <strong>and</strong><br />
$50,000–75,000. Compared to white males, <strong>the</strong>re was a<br />
considerably higher proportion <strong>of</strong> <strong>m<strong>in</strong>orities</strong> <strong>and</strong> lower<br />
proportion <strong>of</strong> females <strong>in</strong> <strong>the</strong> higher <strong>in</strong>come categories<br />
(above $50,000 per year). Regardless <strong>of</strong> education level,<br />
Figure 2. Effects <strong>of</strong> education (top—less than a<br />
bachelor’s degree; bottom—bachelor’s degree or<br />
greater) on <strong>in</strong>come <strong>of</strong> white males, females, <strong>and</strong><br />
<strong>m<strong>in</strong>orities</strong>.<br />
33.3% <strong>of</strong> <strong>m<strong>in</strong>orities</strong> earned more than $50,000 per year,<br />
compared to 22.2% <strong>of</strong> white males <strong>and</strong> 17.4% <strong>of</strong> females.<br />
Increased education with<strong>in</strong> a group did not necessarily<br />
<strong>in</strong>crease <strong>the</strong> proportion <strong>of</strong> those mak<strong>in</strong>g higher <strong>in</strong>come. In<br />
fact, <strong>m<strong>in</strong>orities</strong> <strong>and</strong> white males with at least a BS/BA<br />
actually appear to make less money than those without a<br />
BS/BA, at least by one measure—<strong>the</strong> proportion <strong>of</strong> those<br />
mak<strong>in</strong>g more than $50,000 per year. Forty-two percent <strong>of</strong><br />
<strong>m<strong>in</strong>orities</strong> without a bachelor’s degree made greater than<br />
$50,000 annually, compared to only 29% <strong>of</strong> those with at<br />
least a BS/BA (Figure 2). This pattern holds with white<br />
males as well, but <strong>the</strong> difference is less pronounced. On <strong>the</strong><br />
o<strong>the</strong>r h<strong>and</strong>, females appeared to make more money with at<br />
least a BS/BA than without, <strong>and</strong> no female without a BS/<br />
BA made more than $75,000 a year.<br />
The higher proportion <strong>of</strong> <strong>m<strong>in</strong>orities</strong> <strong>in</strong> <strong>the</strong> high-<strong>in</strong>come<br />
classes <strong>in</strong> this study may be related to <strong>the</strong>ir geographic<br />
location. Of <strong>the</strong> 18 <strong>m<strong>in</strong>orities</strong> with annual <strong>in</strong>come greater<br />
than $50,000, 15 were from <strong>the</strong> West <strong>and</strong> 12 from California.<br />
Mean annual pay <strong>in</strong> California is sixth highest <strong>in</strong><br />
<strong>the</strong> nation (U.S. Census Bureau 1998). The <strong>in</strong>verse relationship<br />
<strong>of</strong> education level <strong>and</strong> <strong>in</strong>come shown here for<br />
<strong>m<strong>in</strong>orities</strong> <strong>and</strong> white males is difficult to expla<strong>in</strong>. More<br />
than half (55%) <strong>of</strong> <strong>the</strong> white males <strong>and</strong> <strong>m<strong>in</strong>orities</strong> with<br />
less than a BS/BA are self-employed <strong>and</strong> most are arborists,<br />
while about two-thirds <strong>of</strong> those with at least a<br />
BS/BA are <strong>in</strong> middle or upper management work<strong>in</strong>g for<br />
someone else.