2007 - ASSESS-HKH
2007 - ASSESS-HKH
2007 - ASSESS-HKH

Create successful ePaper yourself
Turn your PDF publications into a flip-book with our unique Google optimized e-Paper software.
How do you come up with ecological status (M.P. Sharma) – T. Korte answered that this<br />
question is more linked to using a multi-metric index, which is done in comparison with a<br />
reference site. Is there a way to give distinct class or category without comparing the site with<br />
another O. Moog answered that our approach is based on reference conditions and the<br />
composition of the fauna there. Threshold values to be defined for the different types.<br />
Dr. Kahlown asked how many types of substrates and velocity types were considered in the<br />
analysis done How was velocity measured<br />
Velocities measured on class categories from 0-6 estimated by observation or where possible a<br />
current meter (values observed: 0 to more than 1 m/s); 250 samples considered.<br />
Did you look for autocorrelation between the two parameters (flow velocity and substrate type)<br />
(A. Hoffmann) Not specifically, but only a few sites exhibited autocorrelation.<br />
Announcements were made by G. K. Chhopel regarding travel, meals and awards ceremony,<br />
before breaking for lunch.<br />
Session 3: River Quality Mapping, Chaired by A.B.M. Badruzzaman<br />
O. Moog: Fundamentals, application and outlook of the <strong>HKH</strong> screening method using the<br />
Rapid Field Bio-assessment for river quality assessment and for early warning of<br />
impacts/impairment.<br />
see presentation session3_Screening_Moog.pdf<br />
It is different from the more sophisticated <strong>HKH</strong>-BIOS scoring procedure or the multi-metric<br />
assessment methods. In this case the Screening method was used for river quality mapping<br />
(Task 7.2) at six “locations” in the five Asian countries. The maps are then used for Task 7.3.<br />
mitigation strategies.<br />
How to proceed 1) Presentation of screening results (maps) by the Asian partners; 2) evaluate<br />
the field & lab methodology; 3) plausibility of results; 4) contact the stakeholders & policy<br />
makers; 5) develop mitigation strategies. Discuss each of these points in the upcoming<br />
sessions.<br />
Water quality maps and results of the rapid field bioassessment (screening) method<br />
were presented by each of the Asian partners:<br />
• Bangladesh (A.B.M Badruzzaman): see presentation<br />
session3_BD_river_quality_map_Badruzzaman.pdf; Turag, Balu, Buriganga,<br />
Shitalakkya and Dhaleshwari rivers selected. 10 samples done at each site; physical &<br />
chemical parameters; sorting & identification. Sites selected based on: point-source &<br />
non-point source pollution (industries/municipal and agriculture/other). The method<br />
matched reasonably well with visible observations in the field. NEPBIOS did not work<br />
well for these rivers. US approach was also used and compared with <strong>ASSESS</strong>-<strong>HKH</strong><br />
approach. Physiochemical data not represented in the maps. Seasonal variation needs<br />
to be addressed.<br />
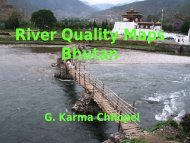
• Bhutan (G. K. Chhopel): see presentation session3_BH_river_quality_map_Chhopel.pdf;<br />
Haa, Paro and Thimpu river systems were sampled. 21 sites in the Haa, Paro and<br />
Thimpu districts and 4 additional sites sampled. Central Thimpu was the worst with<br />
water quality class 5 and other areas nearby had water quality classes of 3, 4 and 3-4.<br />
Some pristine sites were upstream with water quality class 1. Haa had mostly water<br />
quality classes 1 and 2. Paro had water quality classes of 1, 2 and 3. O. Moog<br />
suggested to include more pristine sites which are now missing. Will be better for<br />
presentation to public.<br />
• India (M.P. Sharma): see presentation session3_IN_river_quality_map_MP_Sharma.pdf;<br />
Kosi river system was selected near Roorkee as it covers (flows through) three<br />
3