

GAMA14_ACG_SalarySurvey_F.pdf?utm_content=bufferc75b9&utm_medium=social&utm_source=twitter
GAMA14_ACG_SalarySurvey_F.pdf?utm_content=bufferc75b9&utm_medium=social&utm_source=twitter
GAMA14_ACG_SalarySurvey_F.pdf?utm_content=bufferc75b9&utm_medium=social&utm_source=twitter

Create successful ePaper yourself
Turn your PDF publications into a flip-book with our unique Google optimized e-Paper software.
05<br />
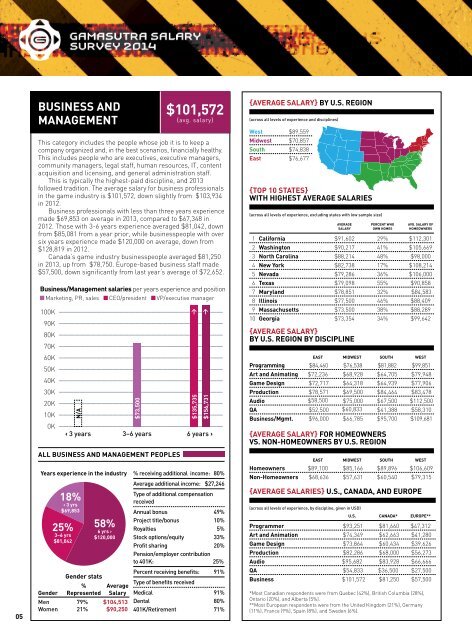
business and<br />
management<br />
$101,572<br />
{avg. salary}<br />
This category includes the people whose job it is to keep a<br />
company organized and, in the best scenarios, financially healthy.<br />
This includes people who are executives, executive managers,<br />
community managers, legal staff, human resources, IT, content<br />
acquisition and licensing, and general administration staff.<br />
This is typically the highest-paid discipline, and 2013<br />
followed tradition. The average salary for business professionals<br />
in the game industry is $101,572, down slightly from $103,934<br />
in 2012.<br />
Business professionals with less than three years experience<br />
made $69,853 on average in 2013, compared to $67,348 in<br />
2012. Those with 3-6 years experience averaged $81,042, down<br />
from $85,081 from a year prior, while businesspeople with over<br />
six years experience made $120,000 on average, down from<br />
$128,819 in 2012.<br />
Canada’s game industry businesspeople averaged $81,250<br />
in 2013, up from $78,750. Europe-based business staff made<br />
$57,500, down significantly from last year’s average of $72,652.<br />
Business/Management salaries per years experience and position<br />
Marketing, PR, sales CEO/president VP/executive manager<br />
100K<br />
90K<br />
80K<br />
70K<br />
60K<br />
50K<br />
40K<br />
30K<br />
20K<br />
10K<br />
0K<br />
N/A<br />
‹ 3 years 3–6 years 6 years ›<br />
ALL BUSINESS AND management PEOPLES<br />
Years experience in the industry % receiving additional income: 80%<br />
Average additional income: $27,246<br />
Type of additional compensation<br />
18%<br />
received<br />
‹ 3 yrs<br />
$69,853<br />
Annual bonus 49%<br />
Project title/bonus 10%<br />
25% 58%<br />
6 yrs ›<br />
Royalties 5%<br />
3–6 yrs<br />
$120,000 Stock options/equity 33%<br />
$81,042<br />
Profit sharing 20%<br />
Pension/employer contribution<br />
to 401K: 25%<br />
Percent receiving benefits: 91%<br />
Type of benefits received<br />
Gender stats<br />
% Average<br />
Gender Represented Salary<br />
Men 79% $104,513<br />
Women 21% $90,250<br />
$73,500<br />
$135,735 ><br />
$156,731 ><br />
Medical 91%<br />
Dental 80%<br />
401K/Retirement 71%<br />
{AVERAGE SALARY} BY u.s. REGION<br />
(across all levels of experience and disciplines)<br />
West $89,559<br />
Midwest $70,857<br />
South $74,838<br />
East $76,677<br />
{Top 10 States}<br />
with Highest Average Salaries<br />
(across all levels of experience, excluding states with low sample size)<br />
AVERAGE Percent Who Avg. Salary of<br />
SALARY Own Homes Homeowners<br />
1 California $91,602 29% $112,301<br />
2 Washington $90,217 41% $105,669<br />
3 North Carolina $88,214 48% $98,000<br />
4 New York $82,738 17% $108,214<br />
5 Nevada $79,286 36% $106,000<br />
6 Texas $79,098 55% $90,858<br />
7 Maryland $78,851 32% $84,583<br />
8 Illinois $77,500 46% $88,409<br />
9 Massachusetts $73,500 38% $88,289<br />
10 Georgia $73,354 34% $99,642<br />
{Average Salary}<br />
BY U.s. region by DISCIPLINE<br />
eAST Midwest South West<br />
Programming $84,460 $76,538 $81,882 $99,851<br />
Art and Animating $72,236 $68,928 $64,705 $79,948<br />
Game Design $72,717 $64,318 $64,939 $77,906<br />
Production $78,571 $69,500 $84,464 $83,478<br />
Audio $58,500 $75,000 $67,500 $112,500<br />
QA $52,500 $60,833 $41,388 $58,310<br />
Business/Mgmt. $96,000 $66,785 $95,700 $109,681<br />
{Average Salary} for homeowners<br />
vs. non-homeowners by u.s. region<br />
eAST Midwest South West<br />
Homeowners $89,100 $85,166 $89,896 $106,609<br />
Non-Homeowners $68,636 $57,631 $60,540 $79,315<br />
{AVERAGE SALARIES} U.S., CANADA, AND EUROPE<br />
(across all levels of experience, by discipline, given in USD)<br />
U.S. CANADA* EUROPE**<br />
Programmer $93,251 $81,660 $47,312<br />
Art and Animation $74,349 $62,663 $41,280<br />
Game Design $73,864 $60,434 $39,626<br />
Production $82,286 $68,000 $56,273<br />
Audio $95,682 $83,928 $66,666<br />
QA $54,833 $36,500 $27,500<br />
Business $101,572 $81,250 $57,500<br />
*Most Canadian respondents were from Quebec (42%), British Columbia (28%),<br />
Ontario (20%), and Alberta (5%).<br />
**Most European respondents were from the United Kingdom (21%), Germany<br />
(11%), France (9%), Spain (8%), and Sweden (6%).