PDF File - Institute for Governance and Policy Studies - Victoria ...
PDF File - Institute for Governance and Policy Studies - Victoria ...
PDF File - Institute for Governance and Policy Studies - Victoria ...

You also want an ePaper? Increase the reach of your titles
YUMPU automatically turns print PDFs into web optimized ePapers that Google loves.
Provoking Debate <strong>and</strong> Learning Lessons: it is early days, but what does the Per<strong>for</strong>mance Improvement Framework<br />
challenge us to think about<br />
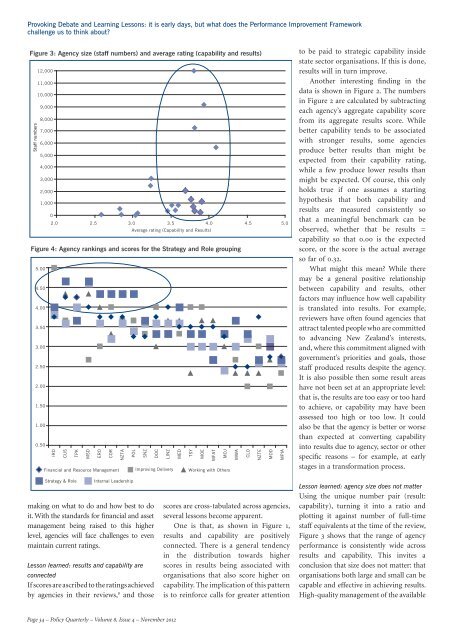
Figure 3: Agency size (staff numbers) <strong>and</strong> average rating (capability <strong>and</strong> results)<br />
Staff numbers<br />
12,000<br />
11,000<br />
10,000<br />
9,000<br />
8,000<br />
7,000<br />
6,000<br />
5,000<br />
4,000<br />
3,000<br />
2,000<br />
1,000<br />
0<br />
2.0 2.5 3.0 3.5 4.0 4.5 5.0<br />
Average rating (Capability <strong>and</strong> Results)<br />
Figure 4: Agency rankings <strong>and</strong> scores <strong>for</strong> the Strategy <strong>and</strong> Role grouping<br />
5.00<br />
4.50<br />
4.00<br />
3.50<br />
3.00<br />
2.50<br />
2.00<br />
1.50<br />
1.00<br />
0.50<br />
IRD<br />
CUS<br />
TPK<br />
MSD<br />
ERO<br />
COR<br />
NZTA<br />
POL<br />
SNZ<br />
DOC<br />
LINZ<br />
MED<br />
TSY<br />
MOE<br />
MFAT<br />
MOJ<br />
MWA<br />
CLO<br />
NZTE<br />
MOD<br />
MPIA<br />
Financial <strong>and</strong> Resource Management Improving Delivery Working with Others<br />
to be paid to strategic capability inside<br />
state sector organisations. If this is done,<br />
results will in turn improve.<br />
Another interesting finding in the<br />
data is shown in Figure 2. The numbers<br />
in Figure 2 are calculated by subtracting<br />
each agency’s aggregate capability score<br />
from its aggregate results score. While<br />
better capability tends to be associated<br />
with stronger results, some agencies<br />
produce better results than might be<br />
expected from their capability rating,<br />
while a few produce lower results than<br />
might be expected. Of course, this only<br />
holds true if one assumes a starting<br />
hypothesis that both capability <strong>and</strong><br />
results are measured consistently so<br />
that a meaningful benchmark can be<br />
observed, whether that be results =<br />
capability so that 0.00 is the expected<br />
score, or the score is the actual average<br />
so far of 0.32.<br />
What might this mean While there<br />
may be a general positive relationship<br />
between capability <strong>and</strong> results, other<br />
factors may influence how well capability<br />
is translated into results. For example,<br />
reviewers have often found agencies that<br />
attract talented people who are committed<br />
to advancing New Zeal<strong>and</strong>’s interests,<br />
<strong>and</strong>, where this commitment aligned with<br />
government’s priorities <strong>and</strong> goals, those<br />
staff produced results despite the agency.<br />
It is also possible then some result areas<br />
have not been set at an appropriate level:<br />
that is, the results are too easy or too hard<br />
to achieve, or capability may have been<br />
assessed too high or too low. It could<br />
also be that the agency is better or worse<br />
than expected at converting capability<br />
into results due to agency, sector or other<br />
specific reasons – <strong>for</strong> example, at early<br />
stages in a trans<strong>for</strong>mation process.<br />
Strategy & Role<br />
Internal Leadership<br />
making on what to do <strong>and</strong> how best to do<br />
it. With the st<strong>and</strong>ards <strong>for</strong> financial <strong>and</strong> asset<br />
management being raised to this higher<br />
level, agencies will face challenges to even<br />
maintain current ratings.<br />
Lesson learned: results <strong>and</strong> capability are<br />
connected<br />
If scores are ascribed to the ratings achieved<br />
by agencies in their reviews, 8 <strong>and</strong> those<br />
scores are cross-tabulated across agencies,<br />
several lessons become apparent.<br />
One is that, as shown in Figure 1,<br />
results <strong>and</strong> capability are positively<br />
connected. There is a general tendency<br />
in the distribution towards higher<br />
scores in results being associated with<br />
organisations that also score higher on<br />
capability. The implication of this pattern<br />
is to rein<strong>for</strong>ce calls <strong>for</strong> greater attention<br />
Lesson learned: agency size does not matter<br />
Using the unique number pair (result:<br />
capability), turning it into a ratio <strong>and</strong><br />
plotting it against number of full-time<br />
staff equivalents at the time of the review,<br />
Figure 3 shows that the range of agency<br />
per<strong>for</strong>mance is consistently wide across<br />
results <strong>and</strong> capability. This invites a<br />
conclusion that size does not matter: that<br />
organisations both large <strong>and</strong> small can be<br />
capable <strong>and</strong> effective in achieving results.<br />
High-quality management of the available<br />
Page 34 – <strong>Policy</strong> Quarterly – Volume 8, Issue 4 – November 2012