Habitat Destruction: Death by a Thousand Cuts - Society for ...
Habitat Destruction: Death by a Thousand Cuts - Society for ...
Habitat Destruction: Death by a Thousand Cuts - Society for ...
- No tags were found...

You also want an ePaper? Increase the reach of your titles
YUMPU automatically turns print PDFs into web optimized ePapers that Google loves.
1<br />
HABITAT DESTRUCTION: DEATH BY A THOUSAND CUTS 85<br />
Box 4.3 (Continued)<br />
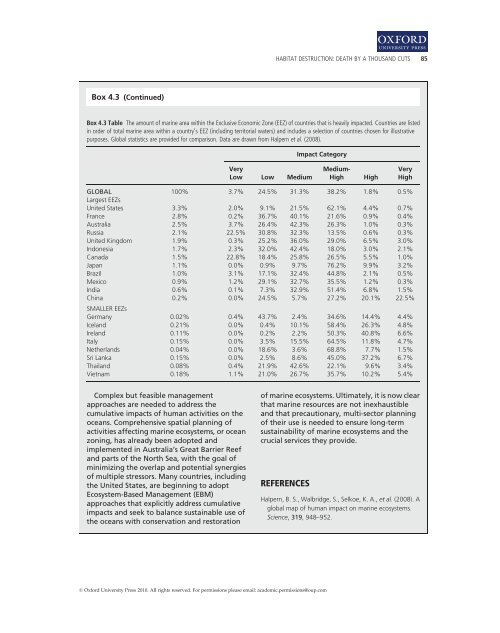
Box 4.3 Table The amount of marine area within the Exclusive Economic Zone (EEZ) of countries that is heavily impacted. Countries are listed<br />
in order of total marine area within a country’s EEZ (including territorial waters) and includes a selection of countries chosen <strong>for</strong> illustrative<br />
purposes. Global statistics are provided <strong>for</strong> comparison. Data are drawn from Halpern et al. (2008).<br />
Country % of global ocean area Impact Category<br />
Very<br />
Low Low Medium<br />
Medium‐<br />
High<br />
High<br />
Very<br />
High<br />
GLOBAL 100% 3.7% 24.5% 31.3% 38.2% 1.8% 0.5%<br />
Largest EEZs<br />
United States 3.3% 2.0% 9.1% 21.5% 62.1% 4.4% 0.7%<br />
France 2.8% 0.2% 36.7% 40.1% 21.6% 0.9% 0.4%<br />
Australia 2.5% 3.7% 26.4% 42.3% 26.3% 1.0% 0.3%<br />
Russia 2.1% 22.5% 30.8% 32.3% 13.5% 0.6% 0.3%<br />
United Kingdom 1.9% 0.3% 25.2% 36.0% 29.0% 6.5% 3.0%<br />
Indonesia 1.7% 2.3% 32.0% 42.4% 18.0% 3.0% 2.1%<br />
Canada 1.5% 22.8% 18.4% 25.8% 26.5% 5.5% 1.0%<br />
Japan 1.1% 0.0% 0.9% 9.7% 76.2% 9.9% 3.2%<br />
Brazil 1.0% 3.1% 17.1% 32.4% 44.8% 2.1% 0.5%<br />
Mexico 0.9% 1.2% 29.1% 32.7% 35.5% 1.2% 0.3%<br />
India 0.6% 0.1% 7.3% 32.9% 51.4% 6.8% 1.5%<br />
China 0.2% 0.0% 24.5% 5.7% 27.2% 20.1% 22.5%<br />
SMALLER EEZs<br />
Germany 0.02% 0.4% 43.7% 2.4% 34.6% 14.4% 4.4%<br />
Iceland 0.21% 0.0% 0.4% 10.1% 58.4% 26.3% 4.8%<br />
Ireland 0.11% 0.0% 0.2% 2.2% 50.3% 40.8% 6.6%<br />
Italy 0.15% 0.0% 3.5% 15.5% 64.5% 11.8% 4.7%<br />
Netherlands 0.04% 0.0% 18.6% 3.6% 68.8% 7.7% 1.5%<br />
Sri Lanka 0.15% 0.0% 2.5% 8.6% 45.0% 37.2% 6.7%<br />
Thailand 0.08% 0.4% 21.9% 42.6% 22.1% 9.6% 3.4%<br />
Vietnam 0.18% 1.1% 21.0% 26.7% 35.7% 10.2% 5.4%<br />
Complex but feasible management<br />
approaches are needed to address the<br />
cumulative impacts of human activities on the<br />
oceans. Comprehensive spatial planning of<br />
activities affecting marine ecosystems, or ocean<br />
zoning, has already been adopted and<br />
implemented in Australia’s Great Barrier Reef<br />
and parts of the North Sea, with the goal of<br />
minimizing the overlap and potential synergies<br />
of multiple stressors. Many countries, including<br />
the United States, are beginning to adopt<br />
Ecosystem‐Based Management (EBM)<br />
approaches that explicitly address cumulative<br />
impacts and seek to balance sustainable use of<br />
the oceans with conservation and restoration<br />
of marine ecosystems. Ultimately, it is now clear<br />
that marine resources are not inexhaustible<br />
and that precautionary, multi‐sector planning<br />
of their use is needed to ensure long‐term<br />
sustainability of marine ecosystems and the<br />
crucial services they provide.<br />
REFERENCES<br />
Halpern, B. S., Walbridge, S., Selkoe, K. A., et al. (2008). A<br />
global map of human impact on marine ecosystems.<br />
Science, 319, 948–952.<br />
© Ox<strong>for</strong>d University Press 2010. All rights reserved. For permissions please email: academic.permissions@oup.com