Endangered species management: the US experience - Society for ...
Endangered species management: the US experience - Society for ...
Endangered species management: the US experience - Society for ...

You also want an ePaper? Increase the reach of your titles
YUMPU automatically turns print PDFs into web optimized ePapers that Google loves.
1<br />
ENDANGERED SPECIES MANAGEMENT: THE <strong>US</strong> EXPERIENCE 221<br />
Box 12.1 Rare and threatened <strong>species</strong> and conservation planning in Madagascar<br />
Claire Kremen, Alison Cameron, Tom Allnutt, and Andriamandimbisoa Razafimpahanana<br />
The fundamental challenge of reserve design is<br />
how to maximize biodiversity conservation given<br />
area constraints, competing land uses and that<br />
extinction risk is already high <strong>for</strong> many <strong>species</strong>,<br />
even without fur<strong>the</strong>r habitat loss. Madagascar is<br />
one of <strong>the</strong> world’s highest priorities <strong>for</strong><br />
conservation (Brooks et al. 2006) with endemism<br />
exceeding 90% <strong>for</strong> many plant and animal<br />
groups (Goodman and Benstead 2005). Recently,<br />
<strong>the</strong> President of Madagascar set <strong>the</strong> target <strong>for</strong><br />
habitat protection at 10% of <strong>the</strong> land surface,<br />
representing a tripling of <strong>the</strong> region to be<br />
protected. This provided an unparalleled<br />
opportunity to protect Madagascar’s<br />
biodiversity. To aid <strong>the</strong> government in site<br />
selection, we used a “systematic conservation<br />
planning” approach (Margules and Pressey 2000)<br />
to identify regions that would protect as many<br />
<strong>species</strong> as possible, especially geographically rare<br />
and threatened <strong>species</strong>, within that 10% target.<br />
We obtained occurrence data <strong>for</strong> 2315<br />
endemic <strong>species</strong> of plants, lemurs, frogs, geckos,<br />
butterflies and ants (see Box 12.1 Figure 1). We<br />
utilized a spatial prioritization decision‐support<br />
tool (Zonation: Moilanen et al. 2005), and input<br />
models of <strong>species</strong> distributions (<strong>for</strong> 829 <strong>species</strong>)<br />
and point data <strong>for</strong> <strong>the</strong> remaining <strong>species</strong> (too<br />
rare to model, designated RTS <strong>for</strong> rare target<br />
<strong>species</strong>). The Zonation algorithm preferentially<br />
selects <strong>the</strong> best habitat <strong>for</strong> geographically rare<br />
(range‐restricted) <strong>species</strong>. In addition, by<br />
supplying weights based on past habitat loss, we<br />
instructed Zonation to favor <strong>species</strong> that had<br />
suffered large range loss within <strong>the</strong> past 50 years<br />
(threatened <strong>species</strong>). In this manner, our decision<br />
support tool picked regions that not only<br />
represented all of <strong>the</strong> <strong>species</strong> in our analysis, but<br />
also identified <strong>the</strong> habitats most important to<br />
geographically rare and/or threatened <strong>species</strong>.<br />
We ran Zonation in three ways: (i) <strong>for</strong> each of<br />
<strong>the</strong> six taxonomic groups alone; (ii) <strong>for</strong> all groups<br />
toge<strong>the</strong>r; and (iii) <strong>for</strong> all groups toge<strong>the</strong>r, after<br />
first selecting existing protected areas, totaling<br />
6.3% of <strong>the</strong> country. We <strong>the</strong>n assessed how well<br />
<strong>the</strong> selected regions <strong>for</strong> each Zonation run<br />
protected rare and threatened <strong>species</strong> by<br />
determining what proportions of <strong>the</strong>ir habitats<br />
(<strong>for</strong> modeled <strong>species</strong>) or occurrence points (<strong>for</strong><br />
RTS <strong>species</strong>) were included. We also compared<br />
Zonation’sselectionsbasedonalltaxa(runii<br />
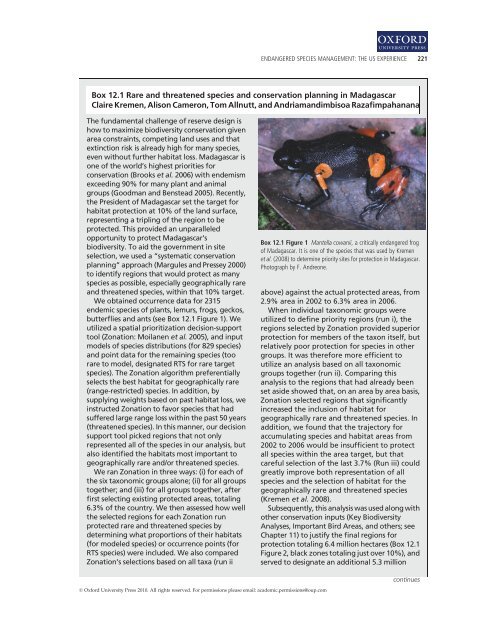
Box 12.1 Figure 1 Mantella cowanii, a critically endangered frog<br />
of Madagascar. It is one of <strong>the</strong> <strong>species</strong> that was used by Kremen<br />
et al. (2008) to determine priority sites <strong>for</strong> protection in Madagascar.<br />
Photograph by F. Andreone.<br />
above) against <strong>the</strong> actual protected areas, from<br />
2.9% area in 2002 to 6.3% area in 2006.<br />
When individual taxonomic groups were<br />
utilized to define priority regions (run i), <strong>the</strong><br />
regions selected by Zonation provided superior<br />
protection <strong>for</strong> members of <strong>the</strong> taxon itself, but<br />
relatively poor protection <strong>for</strong> <strong>species</strong> in o<strong>the</strong>r<br />
groups. It was <strong>the</strong>re<strong>for</strong>e more efficient to<br />
utilize an analysis based on all taxonomic<br />
groups toge<strong>the</strong>r (run ii). Comparing this<br />
analysis to <strong>the</strong> regions that had already been<br />
set aside showed that, on an area by area basis,<br />
Zonation selected regions that significantly<br />
increased <strong>the</strong> inclusion of habitat <strong>for</strong><br />
geographically rare and threatened <strong>species</strong>. In<br />
addition, we found that <strong>the</strong> trajectory <strong>for</strong><br />
accumulating <strong>species</strong> and habitat areas from<br />
2002 to 2006 would be insufficient to protect<br />
all <strong>species</strong> within <strong>the</strong> area target, but that<br />
careful selection of <strong>the</strong> last 3.7% (Run iii) could<br />
greatly improve both representation of all<br />
<strong>species</strong> and <strong>the</strong> selection of habitat <strong>for</strong> <strong>the</strong><br />
geographically rare and threatened <strong>species</strong><br />
(Kremen et al. 2008).<br />
Subsequently, this analysis was used along with<br />
o<strong>the</strong>r conservation inputs (Key Biodiversity<br />
Analyses, Important Bird Areas, and o<strong>the</strong>rs; see<br />
Chapter 11) to justify <strong>the</strong> final regions <strong>for</strong><br />
protection totaling 6.4 million hectares (Box 12.1<br />
Figure 2, black zones totaling just over 10%), and<br />
served to designate an additional 5.3 million<br />
continues<br />
© Ox<strong>for</strong>d University Press 2010. All rights reserved. For permissions please email: academic.permissions@oup.com