Self-healing of a high temperature cured epoxy using poly ...
Self-healing of a high temperature cured epoxy using poly ...
Self-healing of a high temperature cured epoxy using poly ...

You also want an ePaper? Increase the reach of your titles
YUMPU automatically turns print PDFs into web optimized ePapers that Google loves.
4066<br />
C.L. Mangun et al. / Polymer 51 (2010) 4063e4068<br />
a<br />
100<br />
b<br />
100<br />
90<br />
80<br />
80<br />
Catalyst Solution<br />
Catalyst Capsules<br />
(%)<br />
Loss<br />
Mass<br />
70<br />
60<br />
50<br />
40<br />
30<br />
S21 Caps<br />
S31 Caps<br />
S35 Caps<br />
S21/S31 Caps<br />
Mass Loss (%)<br />
60<br />
40<br />
20<br />
20<br />
0 100 200 300 400 500 600<br />
Temperature (C)<br />
0<br />
0 100 200 300 400 500<br />
Temperature (C)<br />
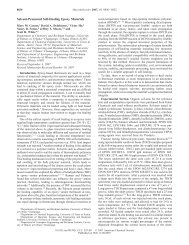
Fig. 4. TGA plots <strong>of</strong> (a) the different PDMS capsules and (b) the catalyst solution (DBTL plus hexyl acetate) with corresponding capsules.<br />
These controls verified if the <strong>healing</strong> was due to the catalyzed<br />
reaction <strong>of</strong> the PDMS and not other factors (e.g. the inherent<br />
tackiness <strong>of</strong> PDMS). Fig. 5 shows representative load-displacement<br />
curves for the S35 control along with its corresponding in situ self<strong>healing</strong><br />
sample. Note the distinct difference in the two plots: the<br />
healed curve has the same stiffness <strong>of</strong> the virgin material until the<br />
PDMS starts to tear away from the crack plane, leading to<br />
a distinctive healed peak. After the healed material debonds, the<br />
curve loads up along the same line as the last segment <strong>of</strong> the virgin<br />
test. For the control sample in the second plot, the curve immediately<br />
lines up with the end <strong>of</strong> the virgin test thus indicating that no<br />
<strong>healing</strong> has taken place.<br />
3.3. Reference and in-situ samples<br />
A summary <strong>of</strong> the TDCB <strong>healing</strong> efficiencies for the PDMS<br />
capsules is shown in Fig. 6. In addition, several sets <strong>of</strong> reference<br />
samples were prepared <strong>of</strong> the matrix <strong>poly</strong>mer alone and healed<br />
manually by injecting a pre-mixed solution <strong>of</strong> the appropriate<br />
<strong>healing</strong> system as described in Methods section (data is represented<br />
as solid lines in Fig. 6).<br />
In order to give a more straightforward comparison <strong>of</strong> the in situ<br />
<strong>healing</strong> data versus each capsule type (since the capsule size and<br />
mass fraction <strong>of</strong> resin in the core varied), the results were plotted<br />
against the amount <strong>of</strong> PDMS delivered (mg/cm 2 ). The mass <strong>of</strong><br />
<strong>healing</strong> agent delivered to the crack plane was calculated with the<br />
equation developed by Rule et al. [10] as:<br />
M Resin ¼ r s 4D c x (2)<br />
where r s is the density <strong>of</strong> the matrix, 4 is the mass fraction <strong>of</strong><br />
microcapsules in the <strong>epoxy</strong> matrix and D c is the mean diameter <strong>of</strong><br />
the microcapsules. In this study, the quantity x represents the<br />
weight fraction <strong>of</strong> PDMS resin in the core (e.g. this value would 1 for<br />
S21, 0.7 for S31, etc.). In addition, several SEM images were taken <strong>of</strong><br />
the fracture surface that clearly indicate ruptured microcapsules<br />
where the PDMS resin has reacted with the catalyst to form an<br />
extensive healed film (Fig. 7).<br />
The reference <strong>healing</strong> efficiencies followed the expected trend,<br />
as the molecular weight increased, the strength <strong>of</strong> the <strong>poly</strong>merized<br />
PDMS resin increased. The blend <strong>of</strong> S21/S31 <strong>healing</strong> mixture fell<br />
between the results for S21 and S31 in almost exactly the calculated<br />
value based on the proportions <strong>of</strong> each component. The in situ<br />
<strong>healing</strong> efficiencies from Fig. 6 exhibit the same trend as observed<br />
for the reference samples. Although quite close for the S21 sample,<br />
the in situ values are <strong>high</strong>er for the <strong>high</strong>er viscosity PDMS samples<br />
when compared to the reference. Typically, TDCB reference tests<br />
are utilized as an indicator <strong>of</strong> the maximum h s that can be achieved<br />
for an encapsulated system. This decrease in <strong>healing</strong> efficiency is<br />
attributed to difficulty <strong>of</strong> injecting the viscous <strong>healing</strong> agents into<br />
the crack plane. <strong>Self</strong>-<strong>healing</strong> samples, however, have uniform<br />
a<br />
80<br />
70<br />
60<br />
Virgin Peak Load<br />
b<br />
120<br />
100<br />
N )<br />
50<br />
N )<br />
80<br />
o a d (<br />
40<br />
o a d (<br />
60<br />
L<br />
30<br />
20<br />
10<br />
Healed Peak Load<br />
Virgin<br />
Healed<br />
L<br />
40<br />
20<br />
Virgin<br />
Healed<br />
0<br />
0 200 400 600 800 1000<br />
0<br />
0 200 400 600 800 1000 1200<br />
Displacement ( µ m)<br />
Displacement ( µ m)<br />
Fig. 5. Representative load-displacement curves for TDCB fracture specimens <strong>of</strong> (a) in situ 5 wt% S35 capsules displaying ca. 33% <strong>healing</strong> efficiency and (b) an S35 control (no<br />
<strong>healing</strong>).