FREE THYROXINE (fT4) ENZYME IMMUNOASSAY TEST ... - Linear
FREE THYROXINE (fT4) ENZYME IMMUNOASSAY TEST ... - Linear
FREE THYROXINE (fT4) ENZYME IMMUNOASSAY TEST ... - Linear
Create successful ePaper yourself
Turn your PDF publications into a flip-book with our unique Google optimized e-Paper software.
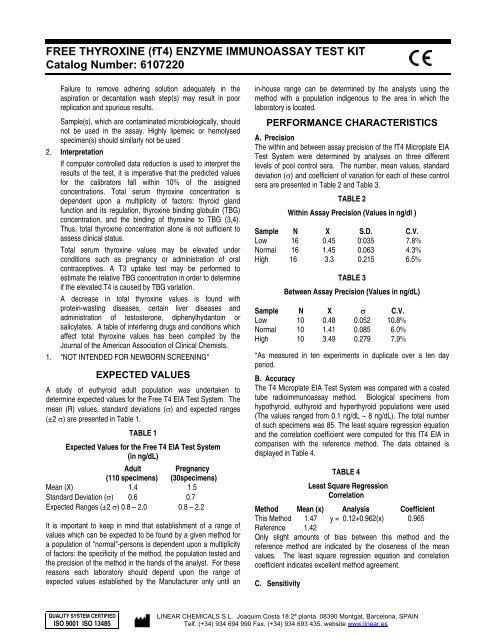
<strong>FREE</strong> <strong>THYROXINE</strong> (<strong>fT4</strong>) <strong>ENZYME</strong> <strong>IMMUNOASSAY</strong> <strong>TEST</strong> KIT<br />
Catalog Number: 6107220<br />
Failure to remove adhering solution adequately in the<br />
aspiration or decantation wash step(s) may result in poor<br />
replication and spurious results.<br />
Sample(s), which are contaminated microbiologically, should<br />
not be used in the assay. Highly lipemeic or hemolysed<br />
specimen(s) should similarly not be used<br />
2. Interpretation<br />
If computer controlled data reduction is used to interpret the<br />
results of the test, it is imperative that the predicted values<br />
for the calibrators fall within 10% of the assigned<br />
concentrations. Total serum thyroxine concentration is<br />
dependent upon a multiplicity of factors: thyroid gland<br />
function and its regulation, thyroxine binding globulin (TBG)<br />
concentration, and the binding of thyroxine to TBG (3,4).<br />
Thus, total thyroxine concentration alone is not sufficient to<br />
assess clinical status.<br />
Total serum thyroxine values may be elevated under<br />
conditions such as pregnancy or administration of oral<br />
contraceptives. A T3 uptake test may be performed to<br />
estimate the relative TBG concentration in order to determine<br />
if the elevated T4 is caused by TBG variation.<br />
A decrease in total thyroxine values is found with<br />
protein-wasting diseases, certain liver diseases and<br />
administration of testosterone, diphenylhydantoin or<br />
salicylates. A table of interfering drugs and conditions which<br />
affect total thyroxine values has been compiled by the<br />
Journal of the American Association of Clinical Chemists.<br />
1. "NOT INTENDED FOR NEWBORN SCREENING"<br />
EXPECTED VALUES<br />
A study of euthyroid adult population was undertaken to<br />
determine expected values for the Free T4 EIA Test System. The<br />
mean (R) values, standard deviations (σ) and expected ranges<br />
(±2 σ) are presented in Table 1.<br />
TABLE 1<br />
Expected Values for the Free T4 EIA Test System<br />
(in ng/dL)<br />
Adult Pregnancy<br />
(110 specimens) (30specimens)<br />
Mean (X) 1.4 1.5<br />
Standard Deviation (σ) 0.6 0.7<br />
Expected Ranges (±2 σ) 0.8 – 2.0 0.8 – 2.2<br />
It is important to keep in mind that establishment of a range of<br />
values which can be expected to be found by a given method for<br />
a population of "normal"-persons is dependent upon a multiplicity<br />
of factors: the specificity of the method, the population tested and<br />
the precision of the method in the hands of the analyst. For these<br />
reasons each laboratory should depend upon the range of<br />
expected values established by the Manufacturer only until an<br />
in-house range can be determined by the analysts using the<br />
method with a population indigenous to the area in which the<br />
laboratory is located.<br />
PERFORMANCE CHARACTERISTICS<br />
A. Precision<br />
The within and between assay precision of the <strong>fT4</strong> Microplate EIA<br />
Test System were determined by analyses on three different<br />
levels of pool control sera. The number, mean values, standard<br />
deviation (σ) and coefficient of variation for each of these control<br />
sera are presented in Table 2 and Table 3.<br />
TABLE 2<br />
Within Assay Precision (Values in ng/dl )<br />
Sample N X S.D. C.V.<br />
Low 16 0.45 0.035 7.8%<br />
Normal 16 1.45 0.063 4.3%<br />
High 16 3.3 0.215 6.5%<br />
TABLE 3<br />
Between Assay Precision (Values in ng/dL)<br />
Sample N X σ C.V.<br />
Low 10 0.48 0.052 10.8%<br />
Normal 10 1.41 0.085 6.0%<br />
High 10 3.49 0.279 7.9%<br />
*As measured in ten experiments in duplicate over a ten day<br />
period.<br />
B. Accuracy<br />
The T4 Microplate EIA Test System was compared with a coated<br />
tube radioimmunoassay method. Biological specimens from<br />
hypothyroid, euthyroid and hyperthyroid populations were used<br />
(The values ranged from 0.1 ng/dL – 8 ng/dL). The total number<br />
of such specimens was 85. The least square regression equation<br />
and the correlation coefficient were computed for this <strong>fT4</strong> EIA in<br />
comparison with the reference method. The data obtained is<br />
displayed in Table 4.<br />
TABLE 4<br />
Least Square Regression<br />
Correlation<br />
Method Mean (x) Analysis Coefficient<br />
This Method 1.47 y = 0.12+0.962(x) 0.965<br />
Reference 1.42<br />
Only slight amounts of bias between this method and the<br />
reference method are indicated by the closeness of the mean<br />
values. The least square regression equation and correlation<br />
coefficient indicates excellent method agreement.<br />
C. Sensitivity<br />
QUALITY SYSTEM CERTIFIED<br />
ISO 9001 ISO 13485<br />
LINEAR CHEMICALS S.L. Joaquim Costa 18 2ª planta. 08390 Montgat, Barcelona, SPAIN<br />
Telf. (+34) 934 694 990 Fax. (+34) 934 693 435. website www.linear.es


