The Uranium Mining Industry and The Uravan ... - Uranium Watch
The Uranium Mining Industry and The Uravan ... - Uranium Watch
The Uranium Mining Industry and The Uravan ... - Uranium Watch
- No tags were found...

Create successful ePaper yourself
Turn your PDF publications into a flip-book with our unique Google optimized e-Paper software.
<strong>The</strong> <strong>Uranium</strong> <strong>Mining</strong> <strong>Industry</strong><br />
<strong>and</strong><br />
<strong>The</strong> <strong>Uravan</strong> Mineral Belt
NOTES<br />
1. Focus of this presentation is on the economics <strong>and</strong> geology of<br />
uranium.<br />
2. First is an overview of the global history of dem<strong>and</strong>, supply <strong>and</strong><br />
price of uranium.<br />
3. Second is an overview of the dem<strong>and</strong> <strong>and</strong> supply situation in the<br />
US.<br />
4. Third is an overview of the <strong>Uravan</strong> Mineral belt.<br />
5. Forth is an overview of the Energy Fuels projects in the UMB.<br />
6. <strong>The</strong> final part of this presentation is a discussion of Energy<br />
Fuels <strong>and</strong> it's Pinon Ridge <strong>and</strong> White Mesa Mills, with<br />
recommendations for encouraging EF to use White Mesa <strong>and</strong> not<br />
build Pinon Ridge.
Periodic Table of the Elements
NOTES<br />
1. <strong>Uranium</strong>, #92, has 6 radioactive isotopes. <strong>The</strong> most common <strong>and</strong> primary one used<br />
for nuclear weapons <strong>and</strong> energy is U235. It ultimately decays to non-radiogenic lead<br />
(#82) through the emission of a series of alpha particles <strong>and</strong> neutrons.<br />
2. Vanadium, #23, is a co-product of uranium in the <strong>Uravan</strong> Mineral Belt (UMB).<br />
3. <strong>The</strong> rare earth elements, #s 57 – 71, with Sc<strong>and</strong>ium (#21) <strong>and</strong> Yttrium (#39),<br />
occasionally occur with uranium, but this is not the case in the UMB.
NOTES<br />
1. Trace amounts of U may occur with REEs, but REEs do not<br />
usually occur with U.<br />
2. REEs are primarily used in electronic equipment (cell phones,<br />
TVs & computers)<br />
3. Currenltly, 97% of global supply is from China<br />
4. Consequently, there is intense exploration activity outside of<br />
China<br />
5. All major sources occur in intrusive rocks – not in<br />
sedimentary rocks<br />
6. Dolores River flows through sedimentary rocks<br />
7. NO evidence that REEs are present in economic amounts in the<br />
UMB.
<strong>Uranium</strong>-Vanadium Ore – Carnotite
NOTES<br />
1. <strong>Uranium</strong> commonly occurs with vanadium in the UMB. <strong>The</strong><br />
weight ratio ranges from about 1:3 to 1:8 <strong>and</strong> averages about 1:5.<br />
2. Ore is mined, hauled to a mill where it is crushed, slurried <strong>and</strong><br />
pulverized. Acids are used to leach the U <strong>and</strong> V from the slurry,<br />
then they are chemically separated, precipitated as oxides <strong>and</strong><br />
dried. <strong>The</strong> remaining rock, which may contain 5-10% of the<br />
original U in the ore, is called mill tailings <strong>and</strong> is pumped to a<br />
tailings pond. Historically, ponds were clay lined <strong>and</strong> over time<br />
began to leak. Currently, ponds are typically lined with two HDPE<br />
(plastic) layers overlying clay <strong>and</strong> separated by s<strong>and</strong>. However, no<br />
on knows how long these will last under long term bombardment<br />
by radiation.<br />
3. Due to the yellow color of the U precipitate it is called<br />
“yellowcake”, with a concentration of 3-5%.<br />
4. Further refining is required to separate U235 from the other U<br />
isotopes to make concentrations high enough for nuclear chain<br />
reactions to occur.
<strong>Uranium</strong> 235<br />
<br />
<br />
<br />
<br />
<br />
Alpha particle emitter (helium nucleus)<br />
Half life – about 700 million years<br />
Fissile in concentrated amounts<br />
Decays to Lead 207<br />
Primary uses are nuclear weapons <strong>and</strong> energy<br />
Typical grade in <strong>Uravan</strong> is 0.25% as U3 O 8
Types of Radiation<br />
Gamma – ray<br />
Beta – electron<br />
Alpha – particle
NOTES<br />
1. U also emits gamma rays, which are detected by geiger<br />
counters. <strong>The</strong>se rays are only harmful to life in high<br />
concentrations. <strong>The</strong> same is true for beta radiation.<br />
2. Alpha radiation is most dangerous to life <strong>and</strong> is probably a<br />
primary cause of DNA mutations. It only travels very short<br />
distances before loosing damaging momentum, so the primary<br />
hazards are ingestion in food or water or inhalation in dust.
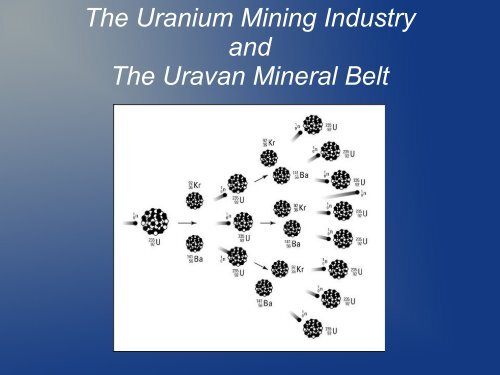
Alpha Radiation
NOTES<br />
1. When a U atom emits an alpha particle, if another U atom is<br />
nearby <strong>and</strong> the alpha particle collides with it, the atom splits,<br />
releasing energy <strong>and</strong> a neutron. If there are enough nearyb U<br />
atoms, the neutron collides with one of them, causing it to split,<br />
producing a chain reaction that releases economic quanities of<br />
energy <strong>and</strong> potentially destructive quantities of energy (i.e. it's<br />
fissile).
World <strong>Uranium</strong> Production & Dem<strong>and</strong>
NOTES<br />
1. From 1945 – 1965, U production was almost entirely for nuclear<br />
weapons.<br />
2. From 1970s' to present, U production has been almost entirely<br />
for nuclear energy.<br />
3. Excess production from 1945 to late 1980s was stockpiled for<br />
use in weapons, but due to international treaties to cease nuclear<br />
weapon production, the stockpiles were used for energy production<br />
<strong>and</strong> consumed by increasing dem<strong>and</strong> by mid the 2000s.
<strong>Uranium</strong> Spot Price History
NOTES<br />
1. Note price in 1980 was $40/lb. This was the price offered since the 1940's for<br />
weapon use. Subsequent prices were based on dem<strong>and</strong> for energy use. Long term<br />
contract prices are affected by spot prices but are usually lower<br />
2. Price spike in 2007-2008 was due to speculation of U shortage.<br />
3. By mid 2000's, stockpiles were depleted <strong>and</strong> mine production was far less than<br />
dem<strong>and</strong>.<br />
4. First major price spike: in 2008, China announced plans to exp<strong>and</strong> nuclear energy<br />
production by over 700% by 2020.<br />
5. Announcement of large high grade reserves in Australia <strong>and</strong> global economic<br />
contraction in 2008-09 resulted in price collapse.<br />
6. Second price spike: in 2011 Globex initiated a <strong>Uranium</strong> futures market <strong>and</strong><br />
speculators drove up the price, but the Fukushima nuclear disasater in Japan ended the<br />
bubble.
Global Nuclear Reactors<br />
Currently operating 440<br />
Under construction 60<br />
Planning stages 150<br />
Proposed 340
NOTES<br />
1. Future prices will depend on whether supply can keep up with<br />
a 125% increase in dem<strong>and</strong> over the next few decades.
Global Production of <strong>Uranium</strong>
NOTES<br />
1. Two of top three producers, Canada <strong>and</strong> Australia, are strong US<br />
allies<br />
2. Production as a percent of world dem<strong>and</strong> is rapidly rising <strong>and</strong> is<br />
expected to continue to meet dem<strong>and</strong> at current prices of $50-$55<br />
per lb.<br />
3. Current deficit of 22% (bottom of 2010 column: 100% -78%) is<br />
met with by-product of polymetalic <strong>and</strong> phosphate mines, resulting<br />
in relative price stability.
<strong>Uranium</strong>: Domestic Dem<strong>and</strong> vs Supply
NOTES<br />
1. USA only supplies 11% of its U dem<strong>and</strong> (18,376 tons).<br />
2. Canada has an excess of supply (about 8,000 tons) that is<br />
adequate to meet about half of US supply deficit.<br />
3. Australia has virtually no domestic dem<strong>and</strong>, so 100% of its<br />
production (5,600 tons) is available.<br />
4. Balance comes from domestic by-product (Florida phosphates)<br />
<strong>and</strong> the world market.
NOTES<br />
1. Australia <strong>and</strong> Canada, two of the USA's strongest allies, will be<br />
major U suppliers for the forseeable future, so a strong domestic<br />
supply is not critical.<br />
2. <strong>The</strong>re are two world markets – major western counties <strong>and</strong><br />
major eastern countries. Currently, Australia <strong>and</strong> Canada supply the<br />
western countries <strong>and</strong> Kazakstan is the major supplier for eastern<br />
countries. However, China has recently entered into contracts to<br />
buy from Australia.
Limits to U308 Dem<strong>and</strong> & Price<br />
<br />
<br />
<br />
<br />
<br />
<br />
Growth in alternative green energy technologies<br />
New technologies that reduce emissions of CO2 from<br />
fossil fuel energy sources<br />
Continued fear of nuclear meltdowns<br />
Continued nuclear waste disposal issues<br />
Long permit lead time <strong>and</strong> high capital cost of new<br />
uranium mines <strong>and</strong> nuclear power plants<br />
Fear of permanent water contamination from uranium<br />
mines <strong>and</strong> mills
NOTES<br />
1. <strong>Uranium</strong> is considered by the US government to be a green<br />
energy source because supply is so high that it is essentially<br />
renewable.<br />
2. USGS studies indicate that US geothermal energy resources are<br />
sufficient to replace coal as the major source of electricity in the<br />
US. This is probably true for China as well. In the long term,<br />
geothermal energy may replace nuclear energy <strong>and</strong> mayalso<br />
reduce Chinese reliance on hydropower.
Global <strong>Uranium</strong> Reserves<br />
<br />
<br />
<br />
<br />
Amount depends on price <strong>and</strong> dem<strong>and</strong><br />
At $60/lb U308 <strong>and</strong> current rates of increase in<br />
dem<strong>and</strong>, reserves are adequate until 2175<br />
As price increases, supply <strong>and</strong> reserves<br />
increase, limiting price<br />
So why explore for <strong>Uranium</strong>
NOTES<br />
1. Contrary to popular belief, geologists are just as susceptible to the streetlight<br />
effect as most people – i.e. they look for minerals where it's easiest to find them<br />
(in deserts).<br />
2. Consequently, we have just begun to explore the earth for U <strong>and</strong> other<br />
resources.<br />
3. <strong>The</strong>re are about 40 companies with over 60 U exploration projects world wide,<br />
many of which have higher grades <strong>and</strong> tonnages than those in the UMB.<br />
4. At some point, supply of U will exceed dem<strong>and</strong>, prices will decline, <strong>and</strong><br />
companies with mines which are marginally economic, such as those in the UMB,<br />
will fail.
US <strong>Uranium</strong> Production History
NOTES<br />
1. From 1940s – 1970s US produced as much as 50% of world<br />
supply.<br />
2. US built over 30 nuclear power plants during the 1960s - 1970s,<br />
but plans to build numerous additional plants in the 1980s were<br />
terminated after the 1979 partial meltdown at Three Mile Isl<strong>and</strong>,<br />
significantly reducing pressure for new domestic supplies of U.<br />
3. Development of large high grade deposits of U in Canada,<br />
Australia <strong>and</strong> Kazakstan in the late 1970s resulted in rapid growth<br />
of a global market.
Major US <strong>Uranium</strong> Reserves
NOTES<br />
1. This map shows the general location of major primary U reserves. Byproduct<br />
resources such as those in FL phosphates are not shown.<br />
2. Note location of mines in the UMB <strong>and</strong> Arizona Strip.
Reserves by State (2008)
NOTES<br />
1. Note that reserves are determined by price, <strong>and</strong> increase at higher prices<br />
because lower grade ores become ecnomic.<br />
2. CO, AZ <strong>and</strong> UT reserves are only 12% of total at $50/lb.
Some Major Types<br />
of <strong>Uranium</strong> Deposits
NOTES<br />
1. Types of U deposits by size <strong>and</strong> grade. IOCG (Olympic Dam)<br />
is primarily iron-gold-copper (U is by product)<br />
2. UMB deposits are a roll front type <strong>and</strong> are relatively low grade<br />
<strong>and</strong> low tonnage, thus likely to be less competitive as supply<br />
increases <strong>and</strong> price decreases.
Types of Mines <strong>and</strong><br />
<strong>Uranium</strong> Recovery Processes<br />
Type %<br />
In Situ (subsurface leaching) 41<br />
Open Pit with surface heap leach 25<br />
Underground with mill & tailings ponds 28
NOTES<br />
1. In Situ Leach (ISL or ISR) is the least expensive <strong>and</strong> most<br />
suitable for deep, large low grade deposits such as those in WY.<br />
2. Open pit with surface heap leach have higher costs than ISL <strong>and</strong><br />
require resources near the surface. Grades can be lower than<br />
underground due to economies of scale.<br />
3. UMB mines have historically been underground with mill <strong>and</strong><br />
tailings pond recovery. <strong>The</strong>y are typically smaller <strong>and</strong> require<br />
higher grades. Reclaimed tailings ponds are visible along the<br />
highway near <strong>Uravan</strong>. EF mines are underground with ore to be<br />
shipped to either the White Mesa or Pinon Ridge mills. <strong>The</strong>re is a<br />
possibility of open pit mining on DOE Lease #7.
<strong>Uranium</strong> Roll-front Mineralization
NOTES<br />
1. Typical of UMB mineralization <strong>and</strong> is usually recovered by underground<br />
mining with mill <strong>and</strong> tailings pond
Roll-front in Outcrop
NOTES<br />
1. Thickness of minerized zone can range from inches to tens of<br />
feet. Areal extent can range from hundreds of square feet to tens of<br />
thous<strong>and</strong>s of square feet.<br />
2. Typically, grade is highest in thinner zones, but mining costs are<br />
also higher, <strong>and</strong> ISL is less likely to be feasible. Thin zones with<br />
relatively small areal extent are typical of UMB.
NOTES<br />
1. Note location of UMB (block with Gateway)<br />
2. Pinenut (acquired from Denison) is near the U in Kaibab Uplift<br />
near the western end of theArizona Strip
Jurassic Stratigraphic Section
NOTES<br />
1. In addition of Salt Wash Member of the Morrison, other U mines on the<br />
Colorado Plateau are either in the basal conglomate of the Chinle Formation<br />
(located just below the Wingate on above section) <strong>and</strong> breccia pipes near the<br />
Gr<strong>and</strong> Canyon located in sedimentary rocks far below the Chinle.
Mesozoic Formations<br />
in Dolores Basin
NOTES<br />
1. Massive orange cliff above river is Wingate S<strong>and</strong>stone (same<br />
cliff viewed in Colorado National Monument south of Gr<strong>and</strong><br />
Junction <strong>and</strong> in the Moab Valley).<br />
2. Note waste spillage from exploration tunnels in the Salt Wash<br />
Formation of Morrison on Tidwell Member of Morrison near<br />
skyline in upper right.
Salt Wash Depositional Environment<br />
~ 150 mya
NOTES<br />
1. <strong>The</strong> Morrision is about 150 million years old <strong>and</strong> is the first<br />
rock to be deposited by east flowing streams in this area after uplift<br />
of the Ancestral Rockies (located in the Uncompagre Plateau area)<br />
about 350 million years ago. This indicates the North American<br />
continental divide had moved from Colorado to Nevada/California<br />
in this area during Morrison time.<br />
2. Mineralization in s<strong>and</strong>y channels deposited by Salt Wash<br />
streams is probably derived from the overlying Brushy Basin<br />
member of the Morrison, which is a colorful gray-purple-green-red<br />
slope forming shale derived from clay alteration of volcanic ash.
Salt Wash Outcrop
NOTES<br />
1. Crossbeds in Salt Wash s<strong>and</strong>stones indicate flow direction.<br />
Mineralization was localized in the Salt Wash by impermable clays<br />
of the underlying Tidwell Member of the Morrison.
<strong>Uravan</strong> Mineral Belt History<br />
For this presentation UMB includes Gateway, Paradox,<br />
Slickrock <strong>and</strong> Bull Canyon uranium deposits<br />
1200 mines operated sporadically from 1900 to present<br />
1900 – 1930's: radium (used for luminous watch faces)<br />
1930s – mid 1940s: vanadium (hardened steel for WWII)<br />
1940s – 1960s: uranium for nuclear weapons<br />
1970s – present: uranium for nuclear power <strong>and</strong><br />
vanadium for tool steel
Vanadium Metal
NOTES<br />
1. Metallic element found with U in UMB<br />
2. Primary use: hardens tool steel<br />
3. Other metals can be used as substitute<br />
4. No global shortage of reserves<br />
5. Typical grade in <strong>Uravan</strong> Mineral Belt is 1.25%<br />
6. V2O5 prices are currently about 10% of price of U, so on<br />
average it adds about 50% to the value of ore.
<strong>Uravan</strong> Historical Production<br />
Worlds largest producer of <strong>Uranium</strong> until 1960s<br />
Current production is insignificant<br />
Totals based on<br />
2010 prices<br />
UMB Production<br />
1900 – 2010<br />
World Production<br />
2010<br />
<strong>Uranium</strong> $3.8 billion $7.1 billion<br />
Vanadium $2.3 billion $8.9 billion<br />
Totals<br />
$ 6.1 billion $16 billion<br />
(100 years) (1 year)
NOTES<br />
1. Even if EF mines begin to operate, total production will not be<br />
significant from a US or global supply perspective.
NOTES<br />
1. A total of 41 DOE leases were first issued (about 25,000 acres),<br />
but only 13 remain active (6585 acres) <strong>and</strong> all of these are on hold<br />
subject to a lawsuit against DOE for failure to abide by NEPA.<br />
Energy Fuels owns a few of these leases.<br />
2. If the DOE is able to comply with NEPA, only a few of the<br />
active leases are likely to be developed. Most are owned by Cotter,<br />
which includes Lease #7, the only lease with open pit potential.<br />
Cotter has permanently closed its uranium mill at Canon City <strong>and</strong><br />
will probably sell its leases to EF.<br />
3. Nearly all historical production was from the DOE leases, where<br />
the USGS identified U resources in the 1940's for military use.<br />
<strong>The</strong>se leases have largely been reclaimed.
NOTES<br />
1. <strong>The</strong>re are about 3800 active unpatented claims on public l<strong>and</strong> managed<br />
by BLM which cover about 80,000 acres.<br />
2. Most are speculative <strong>and</strong> only a few percent will ever be developed.<br />
Energy Fuels has defined reserves on some of them.
Economic Potential<br />
of Leases & Claims<br />
Individual underground mine production ranged<br />
from few tons per day to a few tens of tons per<br />
day, largely due to the thin <strong>and</strong> erratic nature of<br />
mineralization. Up to 100 tons per day is<br />
considered pilot scale mining by modern<br />
st<strong>and</strong>ards.<br />
Historical production from Leases indicates an<br />
average grade of about 0.25% U <strong>and</strong> 1.25% V.<br />
Pilot scale underground mining <strong>and</strong> using a mill<br />
for concentration at grades this low is marginally<br />
profitable at current prices.
NOTES<br />
1. Although many of the leases <strong>and</strong> unpatented mining claims<br />
shown above are in the general vicinity of WSA <strong>and</strong> NCA l<strong>and</strong> in<br />
the Dolores River Basin, none of the EF mines are in this area.<br />
2. It is feasible to truck ore from Whirlwind, Energy Queen, Sage<br />
Plain <strong>and</strong> San Rafael to the White Mesa Mill.<br />
3. Though the Sheep Mountain Project is less advanced than the<br />
projects in the UMB, it is much larger <strong>and</strong> has a greater potential<br />
impact EF stock prices. It is also not located in an area with<br />
extensive potential wilderness.
Whirlwind Mine Cross Section
NOTES<br />
1. This section is typical of UMB mines – high on the edge of the<br />
plateaus.<br />
2. Note thin, erratic mineralization (pink)
Energy Fuels Advanced Projects<br />
Project<br />
Lb U<br />
(millon) % U Lb V<br />
(million)<br />
% V<br />
Ore<br />
Tons Per<br />
Day<br />
Whirlwind 1.003 0.30 3.293 0.97 200<br />
Energy<br />
Queen 1.396 0.32 6.03 1.38 250<br />
Sage<br />
Plain 2.834 0.22 17.828 1.39 300<br />
San<br />
Rafael 3.405 0.225 4.596 0.30 -<br />
Sheep Mtn<br />
(WY)<br />
Pinenut<br />
(AZ)<br />
18.4 0.123 - - -<br />
0.672 0.37 - - -
NOTES<br />
1. Lb U are from NI 43-101 technical reports. <strong>The</strong>se are not<br />
feasibility studies so lbs are not based on price <strong>and</strong> thus are<br />
provisional.<br />
2. Projected production from the first three mines listed is 750 tons<br />
per day, about half of the White Mesa mill capacity.<br />
3. Based on the size of the San Rafael resource, it could produce<br />
500 tons per day. However, based on its grade, both it <strong>and</strong> Sage<br />
Plain will require significantly higher prices to justify production.<br />
4. It is probably not economically feasible to truck ore from Sheep<br />
Mountain WY to the White Mesa Mill (i.e. Sheep Mountian will<br />
require its own mill), but the relatively high grade of Pinenut ore<br />
(south of Kanab) may make it feasible to truck it to White Mesa<br />
(about 300 miles).
Energy Fuels Stock Price History
NOTES<br />
1. EF has been a penny mining stock for at least 5 years, except<br />
for the global bubble from 2006-2008 <strong>and</strong> the U price spike to $70<br />
in 2011. EF stock price increases reflect U price increases <strong>and</strong> are<br />
not due to any news specific to EF.<br />
2. EF stock price was notsignificantly affected by the<br />
announcement of the acquisition of Denison's White Mesa mill <strong>and</strong><br />
US uranium properties, so investors did not see this acquisition as<br />
either favorable or not favorable.
2012 EF & Dension US merger<br />
Denison produces or has produced <strong>Uranium</strong> from<br />
mines in Canada <strong>and</strong> UT <strong>and</strong> has development<br />
stage properties in AZ, UT, Mongolia <strong>and</strong><br />
Zambia. It lost $71 million in 2010, an asset<br />
writedown primarily due to the continuing<br />
decline in uranium prices.<br />
Energy Fuels acquired an operating mine<br />
(Daneros) <strong>and</strong> the White Mesa Mill in UT from<br />
Denison, plus numerous exploration projects. It<br />
also acquired the Pinenut Mine in northwest AZ,<br />
which plans to begin operations this summer.<br />
Denison shareholders will soon own over 66%<br />
of Energy Fuels.
NOTES<br />
1. One of the largest new EF shareholders is Korean Electric Power<br />
Corporation, which has a contract to purchase 20% of Denison's<br />
(<strong>and</strong> thus EF's) uranium production.
Build the Piñon Ridge Mill<br />
or Use White Mesa Mill<br />
<strong>The</strong> Sheep Mountain Alliance sued the Colorado<br />
Department of Public Health <strong>and</strong> Environment in<br />
February 2011 regarding lack of NEPA<br />
compliance for Piñon Ridge Mill permits. It is<br />
likely that this lawsuit <strong>and</strong> the resulting delay in<br />
construction plus limited ore feed to Denison's<br />
White Mesa Mill were a driving factor in EF's<br />
acquisition of this mill .<br />
EFR now has the option of renewing the White<br />
Mesa Mill permits <strong>and</strong> trucking ore from its<br />
<strong>Uravan</strong> Mineral Belt mines to it rather than<br />
building the Piñon Ridge Mill.
Conclusion<br />
1. <strong>The</strong>re is no shortage of uranium for nuclear energy for the<br />
forseeable future.<br />
2. <strong>The</strong>re is global market for uranium <strong>and</strong> vanadium <strong>and</strong> two<br />
of the largest uranium producers are major US allies.<br />
3. Production of uranium from the <strong>Uravan</strong> Mineral Belt is<br />
based solely on potential profit for EF shareholders.<br />
4. Average grades <strong>and</strong> reserves in the <strong>Uravan</strong> Mineral Belt<br />
indicate marginal profitability compared to those of large<br />
resources in US allies such as Australia <strong>and</strong> Canada.<br />
5. Considering the large number of uranium exploration <strong>and</strong><br />
production companies <strong>and</strong> the likelihood that large, low<br />
cost projects will be developed as dem<strong>and</strong> increases, it is<br />
unlikely that the <strong>Uranium</strong> price will increase at a rate that<br />
exceeds production cost inflation rates for significant<br />
periods of time for the forseeable future.
Recommendations<br />
1. Follow the example set by advocates for<br />
limiting uranium mining in the Gr<strong>and</strong> Canyon<br />
area: focus on publicizing water quality issues –<br />
this is the same water.<br />
2. Become shareholders of Energy Fuels <strong>and</strong><br />
encourage the company to put the Piñon Ridge<br />
Mill on hold <strong>and</strong> utilize the White Mesa Mill.<br />
2. Express concern to management <strong>and</strong> to large<br />
shareholders such as Korean Electric Power<br />
Corporation about plans to mine <strong>and</strong> process<br />
uranium ore in environmentally sensitive areas<br />
where strong environmental opposition may<br />
cause lengthy delays <strong>and</strong> higher costs.