Development of a recycling process for Li-ion batteries
Development of a recycling process for Li-ion batteries
Development of a recycling process for Li-ion batteries
- No tags were found...

Create successful ePaper yourself
Turn your PDF publications into a flip-book with our unique Google optimized e-Paper software.
178 T. Georgi-Maschler et al. / Journal <strong>of</strong> Power Sources 207 (2012) 173–182<br />
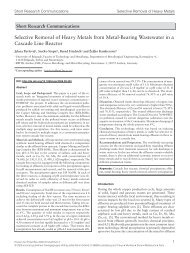
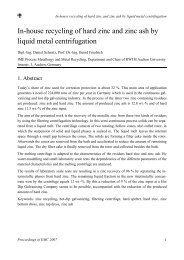
Fig. 5. Metal alloy (left) and slag (right) produced in lab-scale tests.<br />
Table 5<br />
Input and output masses <strong>of</strong> lab-scale test series.<br />
Test no. T holding ( ◦ C) Input (g) Output (g) Expected metal output a (g)<br />
EM pellets Slag Metal Slag<br />
V1a 1760 3500 (LM) 1500 (S1) 1130 690 ∼1000<br />
V1b 1750 3500 (LM) 1500 (S1) 1360 490 ∼1000<br />
V2a 1750 3500 (LM) 1500 (S2) 1330 750 ∼1000<br />
V2b 1740 3500 (LM) 1500 (S2) 680 700 ∼1000<br />
V3a – 3500 (LM) 1500 (S3) No melting phase ∼1000<br />
V3b – 3500 (LM) 1500 (S3) No melting phase ∼1000<br />
V4a 1760 5500 (HM) 1500 (S1) 2450 730 ∼2110<br />
V4b 1730 5500 (HM) 1500 (S1) 2660 850 ∼2110<br />
V5a 1720 5500 (HM) 1500 (S3) 2060 1110 ∼2110<br />
V5b 1700 5500 (HM) 1500 (S3) 2080 1640 ∼2110<br />
V6a 1730 5500 (ZM) 1500 (S1) 2480 740 ∼1740<br />
V6b 1760 5500 (ZM) 1500 (S1) 2540 670 ∼1740<br />
V7a 1740 5500 (ZM) 1500 (S3) 1780 1430 ∼1740<br />
V7b 1720 5500 (ZM) 1500 (S3) 1730 1580 ∼1740<br />
a In case <strong>of</strong> 100% cobalt and copper reduct<strong>ion</strong> and 50% manganese reduct<strong>ion</strong>.<br />
behaviour and after cooling down single solidified metal droplets<br />
can be found which are entrapped and distributed in the slag phase.<br />
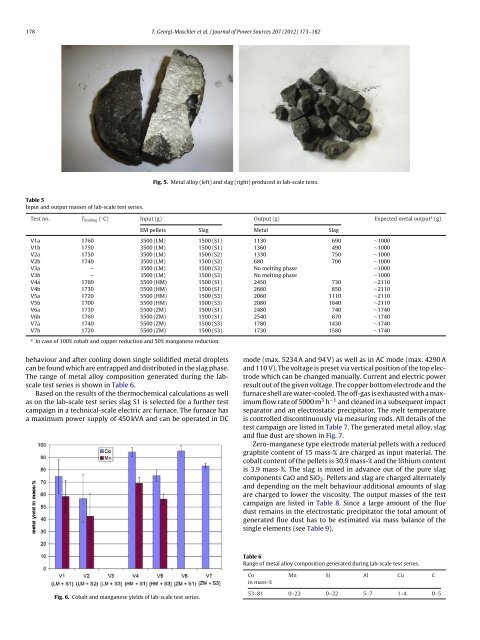
The range <strong>of</strong> metal alloy composit<strong>ion</strong> generated during the labscale<br />
test series is shown in Table 6.<br />
Based on the results <strong>of</strong> the thermochemical calculat<strong>ion</strong>s as well<br />
as on the lab-scale test series slag S1 is selected <strong>for</strong> a further test<br />
campaign in a technical-scale electric arc furnace. The furnace has<br />
a maximum power supply <strong>of</strong> 450 kVA and can be operated in DC<br />
mode (max. 5234 A and 94 V) as well as in AC mode (max. 4290 A<br />
and 110 V). The voltage is preset via vertical posit<strong>ion</strong> <strong>of</strong> the top electrode<br />
which can be changed manually. Current and electric power<br />
result out <strong>of</strong> the given voltage. The copper bottom electrode and the<br />
furnace shell are water-cooled. The <strong>of</strong>f-gas is exhausted with a maximum<br />
flow rate <strong>of</strong> 5000 m 3 h −1 and cleaned in a subsequent impact<br />
separator and an electrostatic precipitator. The melt temperature<br />
is controlled discontinuously via measuring rods. All details <strong>of</strong> the<br />
test campaign are listed in Table 7. The generated metal alloy, slag<br />
and flue dust are shown in Fig. 7.<br />
Zero-manganese type electrode material pellets with a reduced<br />
graphite content <strong>of</strong> 15 mass-% are charged as input material. The<br />
cobalt content <strong>of</strong> the pellets is 30.9 mass-% and the lithium content<br />
is 3.9 mass-%. The slag is mixed in advance out <strong>of</strong> the pure slag<br />
components CaO and SiO 2 . Pellets and slag are charged alternately<br />
and depending on the melt behaviour addit<strong>ion</strong>al amounts <strong>of</strong> slag<br />
are charged to lower the viscosity. The output masses <strong>of</strong> the test<br />
campaign are listed in Table 8. Since a large amount <strong>of</strong> the flue<br />
dust remains in the electrostatic precipitator the total amount <strong>of</strong><br />
generated flue dust has to be estimated via mass balance <strong>of</strong> the<br />
single elements (see Table 9).<br />
Table 6<br />
Range <strong>of</strong> metal alloy composit<strong>ion</strong> generated during lab-scale test series.<br />
Co Mn Si Al Cu C<br />
in mass-%<br />
Fig. 6. Cobalt and manganese yields <strong>of</strong> lab-scale test series.<br />
53–81 0–22 0–22 5–7 1–4 0–5