

December Monthly Report ENG
December Monthly Report ENG
December Monthly Report ENG

Create successful ePaper yourself
Turn your PDF publications into a flip-book with our unique Google optimized e-Paper software.
'<br />
DECEMBER'2013'<br />
!<br />
!<br />
MNR'–'KRG'|'MONTHLY'REPORT'<br />
PART'1:'Iraq'Domestic'Consumption'versus'KRG'Domestic'Consumption'–'EXCLUDING'<br />
!<br />
CONTRACTOR’S'SHARE'<br />
!<br />
!<br />
!<br />
!<br />
KRG'OVERALL'CUMULATIVE'CONSUMPTION'FIGURES'<br />
!<br />
YEAR'<br />
!<br />
exports'via'trucking'(swaps)''<br />
!<br />
!<br />
!<br />
TOTAL'IRAQ'CUMULATIVE'CONSUMPTION'FIGURES'<br />
!<br />
YEAR'<br />
!<br />
!<br />
!<br />
!<br />
!<br />
!<br />
!<br />
!<br />
!<br />
!<br />
!<br />
!<br />
!<br />
!<br />
!<br />
!<br />
KRG'Cumulative'Consumption'Including'<br />
Products'Supplied'by'MoO'(BOE)'<br />
Cumulative'KRG'Refined'&'Used'Excluding'<br />
Supplied'by'MoO'(BOE)'<br />
17%'KRG'Cumulative'<br />
Entitlement'(BOE)'<br />
Cumulative'MoO'Refined'&'Used'<br />
(BOE)'<br />
Cumulative'Surplus/Defecit'<br />
(BOE)'<br />
2004' 14.929.834' 23.790.197' `8.860.363'<br />
2005' 30.597.196' 47.550.648' `16.953.452'<br />
2006' 41.792.199' 73.504.379' `31.712.180'<br />
2007' 52.918.968' 94.662.455' `41.743.486'<br />
2008' 68.059.720' 127.764.982' `59.705.262'<br />
2009' 89.366.436' 160.426.524' `71.060.088'<br />
2010' 113.835.360' 199.023.991' `85.188.631'<br />
2011' 147.219.136' 241.743.083' `94.523.947'<br />
2012' 182.621.909' 286.563.035' `103.941.126'<br />
2013' 239.441.195' 337.784.636' `98.343.442'<br />
Table'9(a):'KRG'annual'cumulative'oil'consumption'excluding'contractor'share'of'processing'in'topping'plants/local'sales,'<br />
Total'Iraq'Cumulative'<br />
Consumption'incl.'KRG'(BOE)'<br />
2004' 147.334' 139.795.000' 139.942.334'<br />
2005' 484.696' 279.225.000' 279.709.696'<br />
2006' 948.699' 431.430.000' 432.378.699'<br />
2007' 1.307.968' 555.530.000' 556.837.968'<br />
2008' 2.213.720' 749.345.000' 751.558.720'<br />
2009' 6.365.436' 937.320.000' 943.685.436'<br />
2010' 19.154.360' 1.151.575.000' 1.170.729.360'<br />
2011' 39.033.136' 1.382.985.000' 1.422.018.136'<br />
2012' 67.135.909' 1.618.529.000' 1.685.664.909'<br />
2013' 115.314.139' 1.871.654.310' 1.986.968.449'<br />
Table'9(b):'Iraq'annual'cumulative'oil'consumption'excluding'contractor'share'of'processing'in'topping'plants/local'sales,'<br />
exports'via'trucking'(swaps)''<br />
2.500.000.000'<br />
2.000.000.000'<br />
1.500.000.000'<br />
1.000.000.000'<br />
500.000.000'<br />
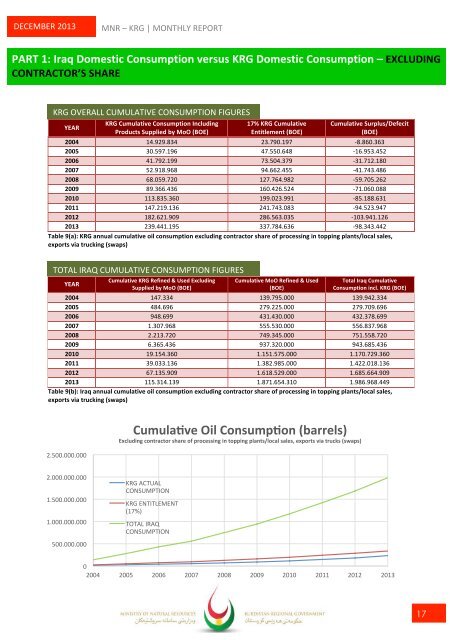
Cumulakve'Oil'Consumpkon'(barrels)'<br />
Excluding'contractor'share'of'processing'in'topping'plants/local'sales,'exports'via'trucks'(swaps)'<br />
KRG'ACTUAL'<br />
CONSUMPTION'<br />
KRG'ENTITLEMENT'<br />
(17%)'<br />
TOTAL'IRAQ'<br />
CONSUMPTION'<br />
0'<br />
2004' 2005' 2006' 2007' 2008' 2009' 2010' 2011' 2012' 2013'<br />
! 17