

trocaire-climate-change-report-2014
trocaire-climate-change-report-2014
trocaire-climate-change-report-2014

Create successful ePaper yourself
Turn your PDF publications into a flip-book with our unique Google optimized e-Paper software.
CO 2 emissions per capita (metric tonnes)<br />
10<br />
9<br />
8<br />
7<br />
6<br />
5<br />
4<br />
3<br />
2<br />
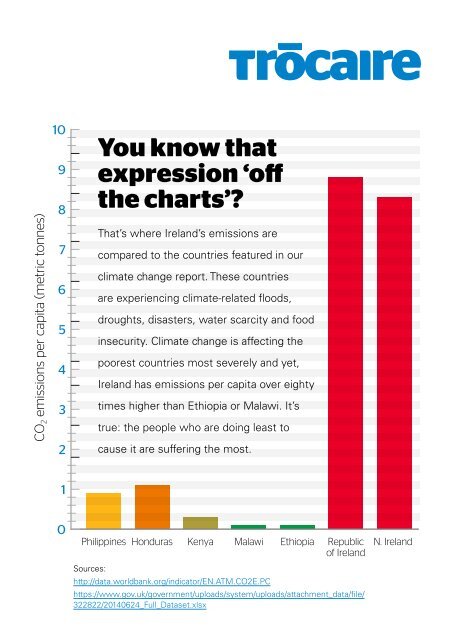
You know that<br />
expression ‘off<br />
the charts’<br />
That’s where Ireland’s emissions are<br />
compared to the countries featured in our<br />
<strong>climate</strong> <strong>change</strong> <strong>report</strong>. These countries<br />
are experiencing <strong>climate</strong>-related floods,<br />
droughts, disasters, water scarcity and food<br />
insecurity. Climate <strong>change</strong> is affecting the<br />
poorest countries most severely and yet,<br />
Ireland has emissions per capita over eighty<br />
times higher than Ethiopia or Malawi. It’s<br />
true: the people who are doing least to<br />
cause it are suffering the most.<br />
1<br />
0<br />
Philippines<br />
Honduras<br />
Kenya<br />
Malawi<br />
Ethiopia<br />
Republic<br />
of Ireland<br />
Sources:<br />
http://data.worldbank.org/indicator/EN.ATM.CO2E.PC<br />
https://www.gov.uk/government/uploads/system/uploads/attachment_data/file/<br />
322822/<strong>2014</strong>0624_Full_Dataset.xlsx<br />
N. Ireland