
You also want an ePaper? Increase the reach of your titles
YUMPU automatically turns print PDFs into web optimized ePapers that Google loves.
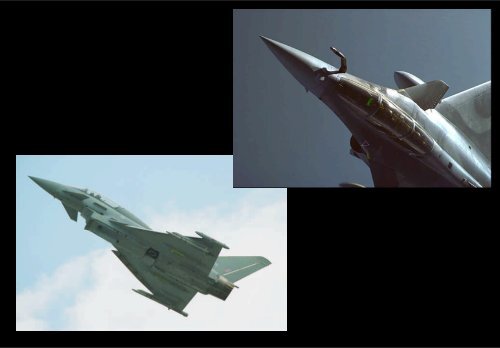
<strong>Typhoon</strong> <strong>vs</strong> <strong>Rafale</strong>
Basic hypothesis<br />
• <strong>Rafale</strong> C and <strong>Typhoon</strong> share the same aerodynamic configuration, means same CL<br />
(lift) and CD (drag) coefficients law [Cx(Mach, AoA)]. This is known as not realistic,<br />
but I do not have reliable data to differentiate them.<br />
– Subjective position may give less Drag at high Mach number to the <strong>Typhoon</strong> and better<br />
Lift at high AoA (>20) for the <strong>Rafale</strong>.<br />
• M88-2 and EJ-200 share same Thrust Profile (coefficient between static thrust and<br />
actual thrust at a given altitude and Mach number configuration) under M=1.8 ,<br />
even mounted behind 2 very different air intake, EJ-200 thrust is assumed to<br />
decrease only after M=2.2. This is known as not realistic, but I do not have reliable<br />
data to differentiate them.<br />
• <strong>Rafale</strong> C and <strong>Typhoon</strong> share Fly Control limits (AoA limitation versus G factor). This<br />
is known as not realistic, but I do not have reliable data to differentiate them.<br />
– Non confirmed information indicated higher AoA values allowed for the <strong>Rafale</strong> (Flight<br />
envelop of the <strong>Typhoon</strong> is still not fully open)
Basic Data<br />
DASSAULT <strong>Rafale</strong> C (M88-2)<br />
Mass Control<br />
Empty Weight (lb)<br />
Internal Fuel<br />
Area Control<br />
Area (Square feet)<br />
lbs kg lbs kg<br />
19,974 9,048<br />
Combat Weight<br />
25,216 11,423<br />
10,486 4,750<br />
(50% Fuel)<br />
sqr. Ft m2<br />
497.99 45.72<br />
G<br />
CAT - I CAT - III<br />
AoA Limit AoA Limit<br />
lbs/lbs.h kg/daN.h<br />
1.00 35.00 20.00 Specic Conso (MIL Power) 0.78 0.80<br />
7.00 30.00 14.00 Specic Conso (AB)<br />
1.67 1.70<br />
10.00 14.00 14.00<br />
Thust lbs kN<br />
Full AB 33,754 150<br />
MIL 22,503 100<br />
EADS <strong>Typhoon</strong> (EJ-200)<br />
Mass Control<br />
Empty Weight (lb)<br />
Internal Fuel<br />
Area Control<br />
Area (Square feet)<br />
lbs kg lbs kg<br />
24,283 11,000<br />
Combat Weight<br />
28,698 13,000<br />
8,830 4,000<br />
(50% Fuel)<br />
sqr. Ft m2<br />
538.07 49.40<br />
G<br />
CAT - I CAT - III<br />
AoA Limit AoA Limit<br />
lbs/lbs.h kg/daN.h<br />
1.00 35.00 20.00 Specic Conso (MIL Power) 0.81 0.83<br />
7.00 30.00 14.00 Specic Conso (AB)<br />
1.73 1.76<br />
10.00 14.00 14.00<br />
Thust lbs kN<br />
Full AB 40,505 180<br />
MIL 27,003 120
Full AB Thrust (lbs)<br />
50,000<br />
Thyphoon<br />
Full AB Thust<br />
45,000<br />
40,000<br />
35,000<br />
EADS <strong>Typhoon</strong> (EJ-200)<br />
(lb)<br />
30,000<br />
25,000<br />
20,000<br />
0<br />
10,000<br />
20,000<br />
30,000<br />
40,000<br />
50,000<br />
60,000<br />
15,000<br />
10,000<br />
5,000<br />
0<br />
0.00 0.25 0.50 0.75 1.00 1.25 1.50 1.75 2.00<br />
Mach<br />
<strong>Rafale</strong> C<br />
Full AB Thust<br />
50,000<br />
45,000<br />
40,000<br />
35,000<br />
DASSAULT <strong>Rafale</strong> C (M88-2)<br />
(lb)<br />
30,000<br />
25,000<br />
20,000<br />
0<br />
10,000<br />
20,000<br />
30,000<br />
40,000<br />
50,000<br />
60,000<br />
15,000<br />
10,000<br />
5,000<br />
0<br />
0.00 0.25 0.50 0.75 1.00 1.25 1.50 1.75 2.00<br />
Mach
Turn Rate Diagram at Sea level with 50% internal fuel (1/2)<br />
Turn Performance at Sea level<br />
<strong>Rafale</strong> C<br />
Drag Index : 0 / GW = 25,200 lbs<br />
Full AB<br />
Turn Performance at Sea level<br />
<strong>Typhoon</strong><br />
Drag Index : 0 GW = 28,700 lbs<br />
Full AB<br />
36<br />
2G<br />
36<br />
2G<br />
5G<br />
5G<br />
32<br />
7G<br />
32<br />
7G<br />
9G<br />
9G<br />
-400<br />
-400<br />
28<br />
-200<br />
28<br />
-200<br />
0<br />
0<br />
24<br />
200<br />
24<br />
200<br />
400<br />
400<br />
600<br />
600<br />
20<br />
800<br />
20<br />
800<br />
(deg / s)<br />
CAT- I<br />
Limit<br />
(deg / s)<br />
CAT- I<br />
Limit<br />
16<br />
16<br />
12<br />
12<br />
8<br />
8<br />
4<br />
4<br />
0<br />
0.00 0.20 0.40 0.60 Mach 0.80 1.00 1.20 1.40<br />
0<br />
0.00 0.20 0.40 0.60 Mach 0.80 1.00 1.20 1.40
Turn Rate Diagram at Sea level with 50% internal fuel (2/2)<br />
• <strong>Rafale</strong> C main data for Turn performance at sea level are:<br />
– Maximum Turn Rate (CAT-I AoA limit) 30.00 deg/s at M=0.50<br />
– Maximum sustained Turn Rate (Ps=0) 23.9 deg/s at M=0.60<br />
• <strong>Typhoon</strong> main data for Turn performance at sea level are:<br />
– Maximum Turn Rate (CAT-I AoA limit) 29.33 deg/s at M=0.50<br />
– Maximum sustained Turn Rate (Ps=0) 23.4 deg/s at M=0.60<br />
• Very small, quite un-significant, advantage to the <strong>Rafale</strong> in turn performance<br />
in such configuration.<br />
Horizontal evolution capabilities of the two planes are very similar.<br />
<strong>Rafale</strong><br />
<strong>Typhoon</strong>
Maximum Excess Specific Power with 50% internal fuel<br />
DASSAULT <strong>Rafale</strong> C (M88-2)<br />
Maximum Ps<br />
Alt (ft) CAS Mach Ps (ft/s)<br />
0 592 0.90 918<br />
5,000 540 0.90 889<br />
10,000 519 0.95 855<br />
15,000 483 0.98 738<br />
20,000 466 1.05 619<br />
25,000 440 1.10 557<br />
30,000 414 1.16 492<br />
35,000 383 1.20 438<br />
40,000 339 1.20 377<br />
45,000 372 1.48 217<br />
50,000 324 1.46 86<br />
55,000 319 1.62 29<br />
• This tables show best Excess Specific Power<br />
(Ps) at 1G, it indicates mainly the initial climb<br />
rate<br />
• <strong>Typhoon</strong> demonstrate higher Excess Specific<br />
Power than the <strong>Rafale</strong> at all altitude (around<br />
10% higher at sea level) in this configuration<br />
(no external loads, 50% internal fuel).<br />
Vertical evolution capabilities of the <strong>Typhoon</strong><br />
are better (10%).<br />
EADS <strong>Typhoon</strong> (EJ-200)<br />
Vz Maximale<br />
Alt (ft) CAS Mach Vz (ft/s)<br />
0 592 0.90 1020<br />
5,000 553 0.92 981<br />
10,000 541 0.99 950<br />
15,000 494 1.00 821<br />
20,000 487 1.09 701<br />
25,000 460 1.15 635<br />
30,000 430 1.20 566<br />
35,000 383 1.20 500<br />
40,000 339 1.20 424<br />
45,000 382 1.52 273<br />
50,000 377 1.69 130<br />
55,000 335 1.70 70<br />
<strong>Rafale</strong><br />
<strong>Typhoon</strong>
Energy (Ps) / Mach Diagram with 50% internal fuel<br />
Energy / Mach Diagram<br />
<strong>Typhoon</strong><br />
Drag Index : 0 GW = 28,700 lbs<br />
Full AB<br />
60,000<br />
Alt (ft)<br />
Alt (ft)<br />
50,000<br />
40,000<br />
30,000<br />
20,000<br />
10,000<br />
60,000<br />
50,000<br />
40,000<br />
30,000<br />
20,000<br />
10,000<br />
0<br />
0.00 0.20 0.40 0.60 0.80 1.00 1.20 1.40 1.60 1.80 2.00 2.20<br />
Mach<br />
Energy / Mach Diagram<br />
<strong>Rafale</strong> C<br />
Drag Index : 0 / GW = 25,200 lbs<br />
Full AB<br />
0<br />
200<br />
400<br />
600<br />
800<br />
IAS=800<br />
0<br />
200<br />
400<br />
600<br />
800<br />
IAS=800<br />
• <strong>Rafale</strong> C gross weight is less<br />
(25,200lbs) but due to extra<br />
thrust, <strong>Typhoon</strong> demonstrate<br />
superior Energy (Ps) at quite<br />
all altitude and Mach giving<br />
him advantage in climb and<br />
acceleration<br />
• Maximum Mach number of<br />
<strong>Rafale</strong> is 1.8 compared to Mach<br />
2.0 for <strong>Typhoon</strong>, mainly due to<br />
stealth characteristics of <strong>Rafale</strong><br />
Air Intake and lack of mobile<br />
devices leading to loss of thrust<br />
for higher mach number<br />
0<br />
0.00 0.20 0.40 0.60 0.80 1.00 1.20 1.40 1.60 1.80 2.00 2.20<br />
Mach
Configuration for 45’ Cruise<br />
• Cruise is supposed to be at FL300 and Mach=0.9, no external loads, and without<br />
after burner (fuel consumption is supposed to be the best specific one gave by<br />
engine manufacturer)<br />
• <strong>Rafale</strong> C (M88-2)<br />
– cruise configuration sustained with a thrust of 3,737 lbs leading to a fuel flow of 2,933<br />
lbs/h,<br />
– 45 minutes of fly in such condition require 2,200 lbs of fuel, given a gross weight of<br />
22,175 lbs<br />
• <strong>Typhoon</strong> (EJ-200)<br />
– cruise configuration sustained with a thrust of 4,040 lbs leading to a fuel flow of 3,289<br />
lbs/h,<br />
– 45 minutes of fly in such condition require 2,467 lbs of fuel, given a gross weight of<br />
26,749 lbs
Turn Rate Diagram at Sea level with 45’ cruise (1/2)<br />
Turn Performance at Sea level<br />
<strong>Rafale</strong> C<br />
Drag Index : 0 / GW = 22,175 lbs<br />
Full AB<br />
Turn Performance at Sea level<br />
<strong>Typhoon</strong><br />
Drag Index : 0 GW = 26,750 lbs<br />
Full AB<br />
36<br />
2G<br />
36<br />
2G<br />
5G<br />
5G<br />
32<br />
7G<br />
32<br />
7G<br />
9G<br />
9G<br />
-400<br />
-400<br />
28<br />
-200<br />
28<br />
-200<br />
0<br />
0<br />
24<br />
200<br />
24<br />
200<br />
400<br />
400<br />
600<br />
600<br />
20<br />
800<br />
20<br />
800<br />
(deg / s)<br />
CAT- I<br />
Limit<br />
(deg / s)<br />
CAT- I<br />
Limit<br />
16<br />
16<br />
12<br />
12<br />
8<br />
8<br />
4<br />
4<br />
0<br />
0.00 0.20 0.40 0.60 Mach 0.80 1.00 1.20 1.40<br />
0<br />
0.00 0.20 0.40 0.60 Mach 0.80 1.00 1.20 1.40
Turn Rate Diagram at Sea level with with 45’ cruise (2/2)<br />
• <strong>Rafale</strong> C main data for Turn performance at sea level are:<br />
– Maximum Turn Rate (CAT-I AoA limit) 32.10 deg/s at M=0.45 (R= 895 ft)<br />
– Maximum sustained Turn Rate (Ps=0) 26.25 deg/s at M=0.55 (R=1,340 ft)<br />
• <strong>Typhoon</strong> main data for Turn performance at sea level are:<br />
– Maximum Turn Rate (CAT-I AoA limit) 30.2 deg/s at M=0.50 (R=1,060 ft)<br />
– Maximum sustained Turn Rate (Ps=0) 25.1 deg/s at M=0.60 (R=1,529 ft)<br />
• Better Turn rate (Maximum and sustained) at lower speed (so with lower Turn<br />
radius), give to the <strong>Rafale</strong> a significant advantage in horizontal evolution in<br />
such configuration.<br />
Horizontal evolution capabilities of the <strong>Rafale</strong> are better.<br />
<strong>Rafale</strong><br />
<strong>Typhoon</strong>
Maximum Excess Specific Power with 45’ cruise fuel<br />
DASSAULT <strong>Rafale</strong> C (M88-2)<br />
Vz Maximale<br />
Alt (ft) CAS Mach Vz (ft/s)<br />
0 592 0.90 1044<br />
5,000 540 0.90 1011<br />
10,000 519 0.95 972<br />
15,000 483 0.98 839<br />
20,000 466 1.05 704<br />
25,000 440 1.10 634<br />
30,000 414 1.16 560<br />
35,000 383 1.20 498<br />
40,000 339 1.20 429<br />
45,000 301 1.20 317<br />
50,000 335 1.50 122<br />
55,000 334 1.69 59<br />
EADS <strong>Typhoon</strong> (EJ-200)<br />
Vz Maximale<br />
Alt (ft) CAS Mach Vz (ft/s)<br />
0 592 0.90 1095<br />
5,000 553 0.92 1053<br />
10,000 541 0.99 1019<br />
15,000 494 1.00 881<br />
20,000 487 1.09 752<br />
25,000 460 1.15 681<br />
30,000 430 1.20 607<br />
35,000 383 1.20 537<br />
40,000 339 1.20 459<br />
45,000 368 1.47 301<br />
50,000 370 1.66 153<br />
55,000 335 1.70 89<br />
• This tables show best Excess Specific Power<br />
(Ps) at 1G, it indicates mainly the initial climb<br />
rate and vertical evolution capability in<br />
dogfight.<br />
• <strong>Typhoon</strong> still demonstrate higher Excess<br />
Specific Power than the <strong>Rafale</strong> at all altitude<br />
(around 5% higher at sea level) but advantage<br />
is lower in this configuration.<br />
Vertical evolution capabilities of the <strong>Typhoon</strong><br />
are better (5%).<br />
<strong>Rafale</strong><br />
<strong>Typhoon</strong>