Inside - First Catholic Slovak Union
Inside - First Catholic Slovak Union
Inside - First Catholic Slovak Union

You also want an ePaper? Increase the reach of your titles
YUMPU automatically turns print PDFs into web optimized ePapers that Google loves.
PAGE JEDNOTA, WEDNESDAY, MARCH 31, 2010<br />
REPORT OF THE EXECUTIVE SECRETARY<br />
PRESENTED AT THE ANNUAL BOARD OF DIRECTORS MEETING,<br />
MARCH 20 – 21, 2010<br />
continued from page 1<br />
The Society used funds available from the Federal Home Loan Bank at very favorable interest<br />
rates to generate interest income for 2009. The funds acquired through the FHLB were managed<br />
by an investment management company which is a subsidiary of Key Bank in Cleveland, Ohio.<br />
Two other significant changes made in the investment area was the Society employing the services<br />
of AQS, an experienced asset management firm to assist in guiding our investment activities<br />
and acquiring Key Bank as our new investment custodian.<br />
Our 2009 premium income is broken down as follows:<br />
Life Insurance $ 1,327,244<br />
Annuities 16,348,878<br />
Total $ 17,676,121<br />
Investment income for 2009 is broken down as follows.<br />
Investment Income for 2009:<br />
Government Bonds $ 1,868,360<br />
Bonds 9,554,133<br />
Preferred Stock 512,467<br />
Common Stock 50,022<br />
Common Stock Affiliates 150,000<br />
Mortgage Loans 149,773<br />
Real Estate 305,554<br />
Certificate Loans 45,903<br />
Short-Term Investments 3,445,116<br />
Other Investment Assets 167,075<br />
Write-ins for Investment Income (469,188)<br />
Total Investment Income $ 15,779,215<br />
Investment Expenses:<br />
Depreciation on Real Estate and Other<br />
Investment Expenses (Investment Taxes,<br />
License Fees, etc.) $ 835,376<br />
Net Investment Income $14,943,839<br />
Listed below is a five-year comparison of assets, premium income and net income.<br />
2005 2006 2007 2008 2009<br />
Assets $195,540,901 $197,310,824 $203,610,335 $201,036,525 $234,794,912<br />
Prem. Income 7,596,237 4,725,837 5,693,973 8,025,584 17,676,121<br />
Invest. Income 11,764,645 11,746,690 12,064,200 12,053,864 14,943,839<br />
Net Gain 1,342,404 1,489,106 1,915,292 1,427,520 4,309,466<br />
Bonds constitute 83.0% (+3.3%) of the Society’s assets, and have an average maturity of 15<br />
years. The Organization enjoys excellent bond quality, with 89.7 (-1.4%) of the bonds in the two<br />
highest NAIC rating classes. Preferred Stocks now make up only 2.8% (-1.5%) of invested assets.<br />
Common Stocks are 1.4% in an effort to diversify the portfolio and increase investment return.<br />
Other assets consist of mortgages (0.9%); real estate (1.4%); and all others (8.4%). The Society<br />
owns $2,019,070 of surplus notes which are listed on Schedule BA and shown as other invested<br />
vvv vvv vvv<br />
Annual Report from Our Chaplain<br />
continued from page 1<br />
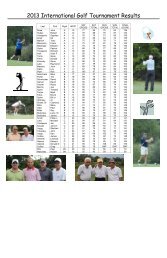
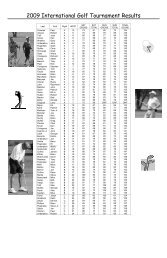
Golf Tournament that was held with the <strong>Slovak</strong> <strong>Catholic</strong> Sokol. I played in the tournament<br />
and celebrated Mass for those who attended.<br />
As a member of the Executive Board of the <strong>Slovak</strong> <strong>Catholic</strong> Federation, I traveled to Bethlehem,<br />
PA in September for a Board meeting. I also was a delegate at the <strong>Slovak</strong> <strong>Catholic</strong><br />
Federation convention held last April in Bethlehem and served on the communication committee.<br />
Throughout the year I have written articles that were published in our fraternal’s newspaper<br />
and have answered correspondence that was sent to me.<br />
The year 2009 was a special year of grace for all of us. May our Lord continue to bless us<br />
in our journey to Him.<br />
Fraternally,<br />
Fr. Thomas A. Nasta<br />
National Chaplain<br />
assets on the asset page. Other Invested Assets also included $17,323,391 obtained through the<br />
FHLB for reinvestment purposes. The Society’s new investment rate of return was 7.1%, which is<br />
higher than the five-year average of 6.5% and excellent in the current market.<br />
The most significant increases in liabilities were: life policy reserves increased 1.1%; annuity reserves<br />
increased 14.9%; deposit type accounts by $10,868,626 (reflects FHLB funds) and Funds<br />
held as trustee 7.5% (Trustee funds represent idle Branch funds deposited for safekeeping with<br />
the Society). AVR increased from $235,339 to $2,514,121 to restore the safety reserve, and the<br />
IMR decreased 47%. Unpaid expenses showed a significant increase as the Convention reserve<br />
($700,000) was properly listed as unpaid instead of as part of a 2008 liability write in item on the<br />
Annual Statement. Average lapse ratio remains at a very favorable 2.26% over the past 5 years.<br />
The society has no Foreign Investments payable in foreign currency. The Foreign Exchange Reserve<br />
was maintained at $10,000.<br />
Surplus increased 45.4% to exceed the 2008 level of $9,059,592. Surplus is at its highest<br />
point, in the history of the Society and currently stands at $13,169.012.<br />
Total life premium income showed a decrease, while annuity premiums increased 149.2%. Overall<br />
premium income increased 120.02%. Investment income increased a very favorable 24.0%<br />
despite the low interest rates currently available and the continuing economic turmoil. Much of the<br />
increase resulted from favorable reinvestment of funds obtained from the FHLB. Overall, total income<br />
for the year increased 60.0%, which will be among the highest increase among fraternals.<br />
Total member benefits were 33.5% lower. Total life benefits were 6% lower; annuity benefits<br />
decreased by 45%. Annuity reserves were considerably higher (+$13,694,000) reflecting the increase<br />
in premium income and decrease in annuity benefits. Commissions were 56.6% higher<br />
reflecting larger production; operation expenses were a modest 3.3% higher, led by General Expenses<br />
which were only 0.7% higher, and taxes were 29.6% higher. Management continues to<br />
control expenses. Dividends to members were 9.8% lower. The Society enjoyed a gain from<br />
operations for the 15th year in a row.<br />
Bond and Preferred Stock capital losses, both realized and unrealized, were reviewed earlier<br />
in this Report.<br />
There are no known trends which will cause future operation results to deviate materially from<br />
2009 results.<br />
The AVR increased by $2,278,782, reversing the large 2008 decrease in this reserve. The increase<br />
in AVR was also detailed earlier in this Report. The IMR decreased 47.0% and now stands<br />
at $1,399,337.<br />
The combination of surplus, AVR and IMR total $17,082.472, an increase of 43% over the same<br />
items in 2008. This amount represents stable funds available for member safety.<br />
The items which provide liquidity are $4,417,205 of cash/short term funds, $3,318,652 of Common<br />
Stock, over $4,200,000 of bonds maturing in less than one year, $17,000,000 of premium<br />
income and almost $15,000,000 of investment income. Expected outgo for benefit payments,<br />
commissions, dividends and expenses is about $12,000,000. The society has more than adequate<br />
liquidity as reflected by the $18,000,000 of cash from operations in 2009.<br />
The Risk Based surplus calculations indicate that total adjusted surplus is $15,883,133, which<br />
is above actual surplus. This does not include the IMR. The total for 50% of the calculated RBC<br />
was $3,359,003 (after RBC Cash Flow Scenario testing which did not require an adjustment entry),<br />
which is substantially lower than actual surplus. The Society’s RBS ratio of 473 is safely above<br />
regulatory action levels.<br />
The Society has only two IRIS Ratios outside the NAIC designated ranges. Both unusual ratios<br />
result from the large increase in premium income.<br />
The Society recorded a decrease of $579,000 for insurance in force. This represents a departure<br />
from other years. Insurance in force has increased 1.8% since 2005.<br />
Our 2009 financial statements, quarterly and year-end were compiled and completed on a timely<br />
basis and filed with the various states in which we are licensed to do business. We are continually<br />
in contact with the regulatory agencies of the various states regarding their requirements, which<br />
are constantly changing. We are in compliance with all of the states’ and NAIC accounting regulations.<br />
In 2009 we had a loss in insurance membership (death claims, cash withdrawals, expels, etc.)<br />
of 1,097members compared to a loss of 1,152 in 2008. We had a decrease in the number of life<br />
insurance certificates of 1,475 in 2009 compared to a loss of 1,269 in 2008.<br />
As of December 31, 2009, the Society had 4,267 annuity certificates. As of December 31, 2009,<br />
annuitant membership totals 1,387 annuitant members (this total does not reflect members who<br />
have both insurance and annuity contracts). The total cash value of our annuity accounts for 2009<br />
continued on page 7
![Kardina;l Tomko na levoc'skej pu;ti zdo]raznil vy;znam manz'elstva U ...](https://img.yumpu.com/50723466/1/190x260/kardinal-tomko-na-levocskej-puti-zdoraznil-vyznam-manzelstva-u-.jpg?quality=85)