

Genetic diversity of orange fruit (Citrus sinensis L.) cultivars in Tunisia using AFLP markers
In Tunisia, Citrus sinensis culture is spread especially in Cap Bon region in the North East. It is represented by a large number of varieties. AFLP (Amplified Fragment Length Polymorphism) markers were used in order to study genetic diversity. Thirty accessions representing the majority of orange germplasm were collected from Cap Bon region. AFLP products were analyzed by capillary electrophoresis on an automated ABI Prism 3130 DNA sequencer. Using GeneMapper, AFLP bands were scored, across all genotypes, for presence (1) or absence (0) and transformed into 0/1 binary matrix. A total of 330 of polymorphic markers were revealed using 3 AFLP primer combinations. These markers expressed a high level of polymorphism allowing the distinction of all accessions. Resolving power (Rp) showed a high rate of collective Rp (97.75) with an average of 32.58. The Polymorphism Information Content (PIC) ranged from 0.16 to 0.22 with an average of 0.18 per primer pair. Genetic similarities were estimated basing on Nei and Li’s (1972) formula. The similarity coefficient between cultivars ranged from 0.15 to 0.96 with an average of 0.76. Most of the accessions showed a high degree of genetic similarity. Additionally, the relationship of the cultivars was also estimated using principal coordinate analysis (PCoA); the first three principal axes explained 94.56 of the total variation. Bioinformatic tools were very useful for investigating the genetic diversity of orange genotypes. Results of this study showed that AFLP markers can be useful tool for investigating the genetic diversity of orange genotypes.
In Tunisia, Citrus sinensis culture is spread especially in Cap Bon region in the North East. It is represented by a large number of varieties. AFLP (Amplified Fragment Length Polymorphism) markers were used in order to study genetic diversity. Thirty accessions representing the majority of orange germplasm were collected from Cap Bon region. AFLP products were analyzed by capillary electrophoresis on an automated ABI Prism 3130 DNA sequencer. Using GeneMapper, AFLP bands were scored, across all genotypes, for presence (1) or absence (0) and transformed into 0/1 binary matrix. A total of 330 of polymorphic markers were revealed using 3 AFLP primer combinations. These markers expressed a high level of polymorphism allowing the distinction of all accessions. Resolving power (Rp) showed a high rate of collective Rp (97.75) with an average of 32.58. The Polymorphism Information Content (PIC) ranged from 0.16 to 0.22 with an average of 0.18 per primer pair. Genetic similarities were estimated basing on Nei and Li’s (1972) formula. The similarity coefficient between cultivars ranged from 0.15 to 0.96 with an average of 0.76. Most of the accessions showed a high degree of genetic similarity. Additionally, the relationship of the cultivars was also estimated using principal coordinate analysis (PCoA); the first three principal axes explained 94.56 of the total variation. Bioinformatic tools were very useful for investigating the genetic diversity of orange genotypes. Results of this study showed that AFLP markers can be useful tool for investigating the genetic diversity of orange genotypes.

You also want an ePaper? Increase the reach of your titles
YUMPU automatically turns print PDFs into web optimized ePapers that Google loves.
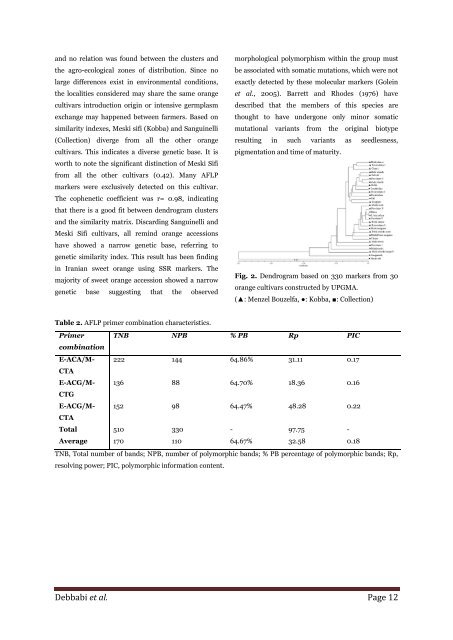
and no relation was found between the clusters and<br />
the agro-ecological zones <strong>of</strong> distribution. S<strong>in</strong>ce no<br />
large differences exist <strong>in</strong> environmental conditions,<br />
the localities considered may share the same <strong>orange</strong><br />
<strong>cultivars</strong> <strong>in</strong>troduction orig<strong>in</strong> or <strong>in</strong>tensive germplasm<br />
exchange may happened between farmers. Based on<br />
similarity <strong>in</strong>dexes, Meski sifi (Kobba) and Sangu<strong>in</strong>elli<br />
(Collection) diverge from all the other <strong>orange</strong><br />
<strong>cultivars</strong>. This <strong>in</strong>dicates a diverse genetic base. It is<br />
worth to note the significant dist<strong>in</strong>ction <strong>of</strong> Meski Sifi<br />
from all the other <strong>cultivars</strong> (0.42). Many <strong>AFLP</strong><br />
<strong>markers</strong> were exclusively detected on this cultivar.<br />
The cophenetic coefficient was r= 0.98, <strong>in</strong>dicat<strong>in</strong>g<br />
that there is a good fit between dendrogram clusters<br />
and the similarity matrix. Discard<strong>in</strong>g Sangu<strong>in</strong>elli and<br />
Meski Sifi <strong>cultivars</strong>, all rem<strong>in</strong>d <strong>orange</strong> accessions<br />
have showed a narrow genetic base, referr<strong>in</strong>g to<br />
genetic similarity <strong>in</strong>dex. This result has been f<strong>in</strong>d<strong>in</strong>g<br />
<strong>in</strong> Iranian sweet <strong>orange</strong> us<strong>in</strong>g SSR <strong>markers</strong>. The<br />
majority <strong>of</strong> sweet <strong>orange</strong> accession showed a narrow<br />
genetic base suggest<strong>in</strong>g that the observed<br />
morphological polymorphism with<strong>in</strong> the group must<br />
be associated with somatic mutations, which were not<br />
exactly detected by these molecular <strong>markers</strong> (Gole<strong>in</strong><br />
et al., 2005). Barrett and Rhodes (1976) have<br />
described that the members <strong>of</strong> this species are<br />
thought to have undergone only m<strong>in</strong>or somatic<br />
mutational variants from the orig<strong>in</strong>al biotype<br />
result<strong>in</strong>g <strong>in</strong> such variants as seedlesness,<br />
pigmentation and time <strong>of</strong> maturity.<br />
Fig. 2. Dendrogram based on 330 <strong>markers</strong> from 30<br />
<strong>orange</strong> <strong>cultivars</strong> constructed by UPGMA.<br />
(▲: Menzel Bouzelfa, ●: Kobba, ■: Collection)<br />
Table 2. <strong>AFLP</strong> primer comb<strong>in</strong>ation characteristics.<br />
Primer TNB NPB % PB Rp PIC<br />
comb<strong>in</strong>ation<br />
E-ACA/M- 222 144 64.86% 31.11 0.17<br />
CTA<br />
E-ACG/M- 136 88 64.70% 18.36 0.16<br />
CTG<br />
E-ACG/M- 152 98 64.47% 48.28 0.22<br />
CTA<br />
Total 510 330 - 97.75 -<br />
Average 170 110 64.67% 32.58 0.18<br />
TNB, Total number <strong>of</strong> bands; NPB, number <strong>of</strong> polymorphic bands; % PB percentage <strong>of</strong> polymorphic bands; Rp,<br />
resolv<strong>in</strong>g power; PIC, polymorphic <strong>in</strong>formation content.<br />
Debbabi et al. Page 12


