Modified Sol-Gel Synthesis of Vanadium Oxide Nanocomposites ...
Modified Sol-Gel Synthesis of Vanadium Oxide Nanocomposites ...
Modified Sol-Gel Synthesis of Vanadium Oxide Nanocomposites ...

You also want an ePaper? Increase the reach of your titles
YUMPU automatically turns print PDFs into web optimized ePapers that Google loves.
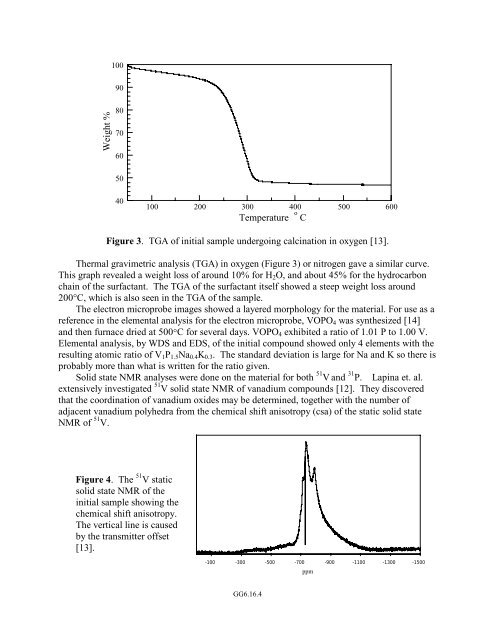
100<br />
90<br />
Weight %<br />
80<br />
70<br />
60<br />
50<br />
40<br />
100 200 300 400 500 600<br />
Temperature o C<br />
Figure 3. TGA <strong>of</strong> initial sample undergoing calcination in oxygen [13].<br />
Thermal gravimetric analysis (TGA) in oxygen (Figure 3) or nitrogen gave a similar curve.<br />
This graph revealed a weight loss <strong>of</strong> around 10% for H 2 O, and about 45% for the hydrocarbon<br />
chain <strong>of</strong> the surfactant. The TGA <strong>of</strong> the surfactant itself showed a steep weight loss around<br />
200°C, which is also seen in the TGA <strong>of</strong> the sample.<br />
The electron microprobe images showed a layered morphology for the material. For use as a<br />
reference in the elemental analysis for the electron microprobe, VOPO 4 was synthesized [14]<br />
and then furnace dried at 500°C for several days. VOPO 4 exhibited a ratio <strong>of</strong> 1.01 P to 1.00 V.<br />
Elemental analysis, by WDS and EDS, <strong>of</strong> the initial compound showed only 4 elements with the<br />
resulting atomic ratio <strong>of</strong> V 1 P 1.5 Na 0.4 K 0.3 . The standard deviation is large for Na and K so there is<br />
probably more than what is written for the ratio given.<br />
<strong>Sol</strong>id state NMR analyses were done on the material for both 51 V and 31 P. Lapina et. al.<br />
extensively investigated 51 V solid state NMR <strong>of</strong> vanadium compounds [12]. They discovered<br />
that the coordination <strong>of</strong> vanadium oxides may be determined, together with the number <strong>of</strong><br />
adjacent vanadium polyhedra from the chemical shift anisotropy (csa) <strong>of</strong> the static solid state<br />
NMR <strong>of</strong> 51 V.<br />
Figure 4. The 51 V static<br />
solid state NMR <strong>of</strong> the<br />
initial sample showing the<br />
chemical shift anisotropy.<br />
The vertical line is caused<br />
by the transmitter <strong>of</strong>fset<br />
[13].<br />
-100<br />
-300<br />
-500<br />
-700<br />
ppm<br />
-900<br />
-1100<br />
-1300<br />
-1500<br />
GG6.16.4