102 SUMMARY TABLES Table S–7. Proposed Budget in Population- and Inflation-Adjusted Dollars (In billions of constant dollars, adjusted for population growth) <strong>2016</strong> 2017 2018 2019 2020 2021 2022 2023 2024 2025 Outlays: Appropriated (“discretionary”) programs: Defense ................................................................................ 605 577 548 530 520 510 505 500 495 489 Non-defense ......................................................................... 563 564 552 540 525 513 493 481 475 469 Subtotal, appropriated programs .................................. 1,168 1,141 1,100 1,069 1,045 1,023 998 981 970 958 Mandatory programs: Social Security ..................................................................... 938 963 989 1,017 1,045 1,071 1,099 1,127 1,157 1,187 Medicare .............................................................................. 583 567 551 588 609 630 681 678 670 723 Medicaid ............................................................................... 351 354 360 368 377 386 396 406 418 430 Other mandatory programs ................................................ 662 702 739 730 729 737 712 731 749 729 Allowance for immigration reform ..................................... 8 11 17 22 25 25 29 33 38 42 Subtotal, mandatory programs ..................................... 2,543 2,596 2,656 2,725 2,785 2,849 2,917 2,975 3,031 3,111 Net interest ................................................................................ 283 351 399 441 481 511 539 564 581 595 Adjustments for disaster costs 1 ................................................. 6 7 8 8 8 8 8 8 8 8 Receipts: Total outlays ........................................................................ 3,999 4,095 4,163 4,243 4,319 4,392 4,462 4,528 4,590 4,672 Individual income taxes ............................................................. 1,646 1,719 1,776 1,824 1,872 1,922 1,972 2,021 2,065 2,108 Corporation income taxes .......................................................... 473 485 473 463 453 423 407 407 405 402 Social insurance and retirement receipts: Social Security payroll taxes ............................................. 801 819 833 844 852 871 886 898 911 921 Medicare payroll taxes ....................................................... 245 251 257 261 264 269 274 278 282 285 Unemployment insurance ................................................... 56 59 56 52 51 51 53 53 53 53 Other retirement ................................................................. 9 10 10 10 10 10 10 11 11 11 Excise taxes ................................................................................ 112 117 115 113 112 110 109 108 107 107 Estate and gift taxes .................................................................. 21 30 31 33 34 36 38 40 42 44 Customs duties ........................................................................... 38 41 42 43 44 45 46 47 48 49 Deposits of earnings, Federal Reserve System ......................... 77 46 37 37 41 44 47 49 51 51 Other miscellaneous receipts .................................................... 43 58 55 55 56 55 55 54 55 55 Allowance for immigration reform ............................................ 2 12 26 36 40 40 46 52 60 66 Total receipts ....................................................................... 3,525 3,646 3,712 3,771 3,829 3,877 3,943 4,017 4,091 4,152 Deficit ............................................................................................. 474 449 451 472 490 514 520 511 499 520 Net interest ................................................................................ 283 351 399 441 481 511 539 564 581 595 Primary deficit / surplus (–) ................................................. 191 99 51 31 9 3 –19 –52 –82 –75 On-budget deficit ........................................................................ 477 440 427 433 428 442 433 403 372 370 Off-budget deficit / surplus (–) ................................................... –3 9 24 39 62 72 87 108 127 151
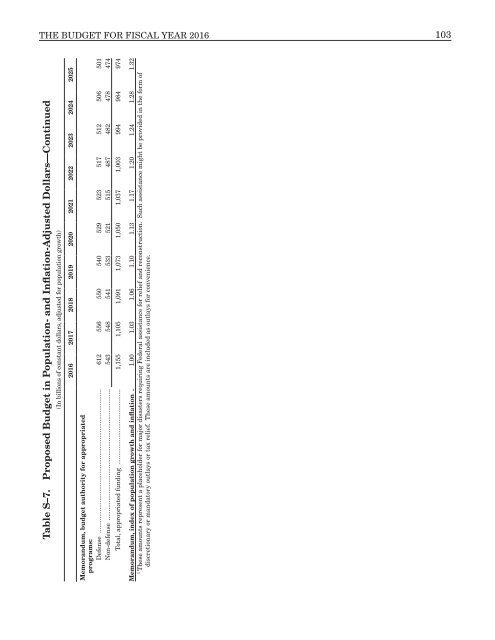
THE <strong><strong>BUD</strong>GET</strong> FOR FISCAL YEAR <strong>2016</strong> 103 Table S–7. Proposed Budget in Population- and Inflation-Adjusted Dollars—Continued (In billions of constant dollars, adjusted for population growth) <strong>2016</strong> 2017 2018 2019 2020 2021 2022 2023 2024 2025 Memorandum, budget authority for appropriated programs: Defense ................................................................................ 612 556 550 540 529 523 517 512 506 501 Non-defense ......................................................................... 543 548 541 533 521 515 487 482 478 474 Total, appropriated funding .......................................... 1,155 1,105 1,091 1,073 1,050 1,037 1,003 994 984 974 Memorandum, index of population growth and inflation . 1.00 1.03 1.06 1.10 1.13 1.17 1.20 1.24 1.28 1.32 1 These amounts represent a placeholder for major disasters requiring Federal assistance for relief and reconstruction. Such assistance might be provided in the form of discretionary or mandatory outlays or tax relief. These amounts are included as outlays for convenience.