Determinants and Dynamics of Micronesian Emigration
Determinants and Dynamics of Micronesian Emigration
Determinants and Dynamics of Micronesian Emigration
SHOW LESS

You also want an ePaper? Increase the reach of your titles
YUMPU automatically turns print PDFs into web optimized ePapers that Google loves.
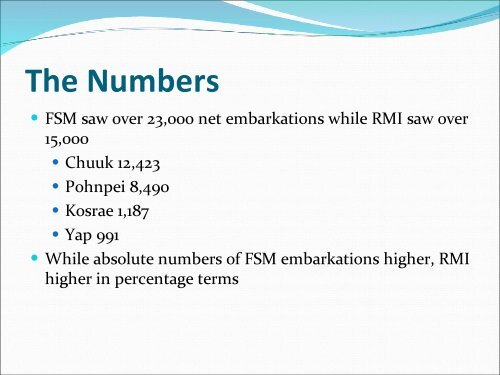
The Numbers<br />
FSM saw over 23,000 net embarkations while RMI saw over<br />
15,000<br />
Chuuk 12,423<br />
Pohnpei 8,490<br />
Kosrae 1,187<br />
Yap 991<br />
While absolute numbers <strong>of</strong> FSM embarkations higher, RMI<br />
higher in percentage terms