Energy and Water Strategy 2007-2010 - Sustainable Blue Mountains
Energy and Water Strategy 2007-2010 - Sustainable Blue Mountains
Energy and Water Strategy 2007-2010 - Sustainable Blue Mountains

You also want an ePaper? Increase the reach of your titles
YUMPU automatically turns print PDFs into web optimized ePapers that Google loves.
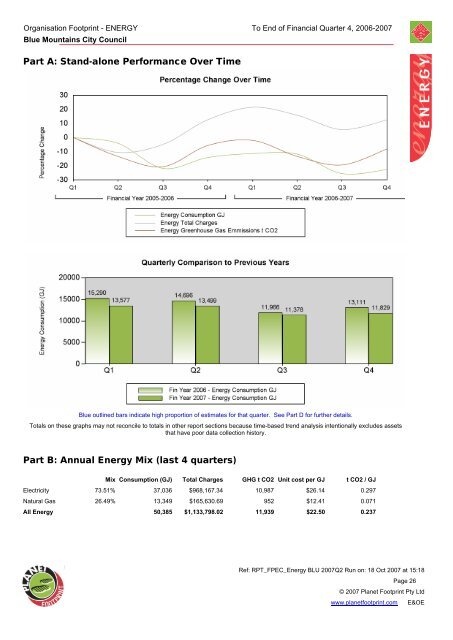
Organisation Footprint - ENERGY<br />
<strong>Blue</strong> <strong>Mountains</strong> City Council<br />
To End of Financial Quarter 4, 2006-<strong>2007</strong><br />
Part A: St<strong>and</strong>-alone Performance Over Time<br />
<strong>Blue</strong> outlined bars indicate high proportion of estimates for that quarter. See Part D for further details.<br />
Totals on these graphs may not reconcile to totals in other report sections because time-based trend analysis intentionally excludes assets<br />
that have poor data collection history.<br />
Part B: Annual <strong>Energy</strong> Mix (last 4 quarters)<br />
Mix Consumption (GJ) Total Charges GHG t CO2 Unit cost per GJ t CO2 / GJ<br />
Electricity 73.51% 37,036 $968,167.34 10,987 $26.14 0.297<br />
Natural Gas 26.49% 13,349 $165,630.69 952 $12.41 0.071<br />
All <strong>Energy</strong> 50,385 $1,133,798.02 11,939 $22.50 0.237<br />
Ref: RPT_FPEC_<strong>Energy</strong> BLU <strong>2007</strong>Q2 Run on: 18 Oct <strong>2007</strong> at 15:18<br />
Page 26<br />
© <strong>2007</strong> Planet Footprint Pty Ltd<br />
www.planetfootprint.com E&OE