PREVIOUS IIFT QUESTION PAPER
PREVIOUS IIFT QUESTION PAPER
PREVIOUS IIFT QUESTION PAPER

You also want an ePaper? Increase the reach of your titles
YUMPU automatically turns print PDFs into web optimized ePapers that Google loves.
58. If the world energy council formulates a norm for<br />
high emission countries to reduce their emission<br />
each year by 12.5% for the next two years then<br />
what would be the ratio of CO2 emission to per<br />
capita income of US, China and Japan after two<br />
years. The per capita income of China, Japan and<br />
US is expected to increase every year by 4%, 3%<br />
and 2% respectively.<br />
(1) 3.5, 3.8, 4.1 (2) 3.4, 3.5, 3.9<br />
(3) 2.9, 3.1, 3.4 (4) None<br />
59. If US and China, decide to buy carbon credits,<br />
from Spain and Ukraine to make up for their high<br />
emissions, then in how many years US, and China<br />
would be able to bring down its ratio of CO2<br />
emission (million ton) to per capita income to<br />
world standard benchmark of 0.75. (per capita<br />
income of the given countries remain same, 0.5<br />
CO2 emissions [million ton] is compensated by<br />
purchase of 1.25 units of carbon credit, and a<br />
country can buy carbon credit units in three lots<br />
of 15, 20 and 30 units in a single year.)<br />
(1) 3.8 years (2) 38 years<br />
(3) 30 years (4) None<br />
60. France, South Africa, Australia, Ukraine and<br />
Poland form an energy consortium which<br />
declares CO2 emission of 350 million ton per<br />
annum as standard benchmark. The energy<br />
consortium decides to sell their carbon emission<br />
savings against the standard benchmark to high<br />
carbon emission countries. It is expected that the<br />
per capita income of each country of the energy<br />
consortium increases by 2%, 2.5% and 3.5% p.a.<br />
for the next three years respectively. The ratio of<br />
CO2 emission to per capita income of the each<br />
energy consortium country reduces by 50% and<br />
remains constant for the next three years. By<br />
selling 0.5 CO2 emissions [million ton] the energy<br />
consortium earns 1.25 carbon credits, then<br />
determine the total carbon credits earned by<br />
energy consortium in three years.<br />
(1) 3560 (2) 4506<br />
(3) 5060 (4) None<br />
<strong>IIFT</strong> 2010<br />
61. Select the wrong statement in reference to the<br />
position of India vis-à-vis other countries in the<br />
graph in terms of the ratio of CO2 emission to per<br />
capita income (increasing order).<br />
(1) India stands at 5 th position if 50 is added to<br />
the given per capita income figures of each<br />
country.<br />
(2) India stands at 5 th position at the given CO2<br />
emission level and per capita income of each<br />
country.<br />
(3) India stands at 5 th position if 200 million ton<br />
CO2 emission is deducted from the given CO2<br />
emission figures of each country.<br />
(4) India stands at 5 th position if 200 million ton<br />
CO2 emission is deducted from the given CO2<br />
emission figures of each country and 50 is<br />
added to the given per capita income of each<br />
country.<br />
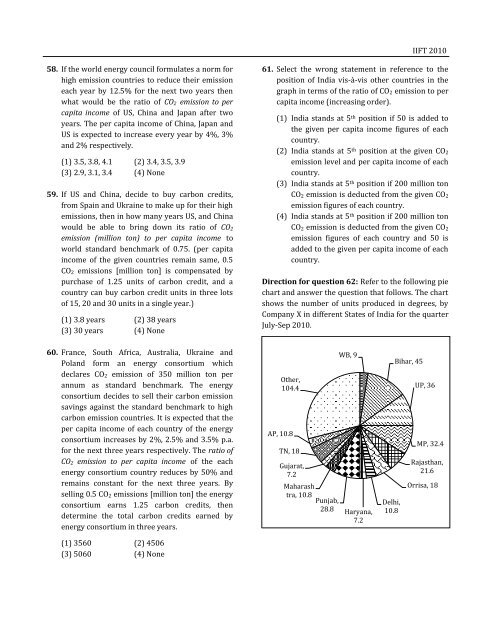
Direction for question 62: Refer to the following pie<br />
chart and answer the question that follows. The chart<br />
shows the number of units produced in degrees, by<br />
Company X in different States of India for the quarter<br />
July-Sep 2010.<br />
Other,<br />
104.4<br />
AP, 10.8<br />
TN, 18<br />
Gujarat,<br />
7.2<br />
Maharash<br />
tra, 10.8<br />
Punjab,<br />
28.8<br />
WB, 9<br />
Haryana,<br />
7.2<br />
Delhi,<br />
10.8<br />
Bihar, 45<br />
UP, 36<br />
MP, 32.4<br />
Rajasthan,<br />
21.6<br />
Orrisa, 18