

Daniels-et-al-(2015)
Daniels-et-al-(2015)
Daniels-et-al-(2015)

You also want an ePaper? Increase the reach of your titles
YUMPU automatically turns print PDFs into web optimized ePapers that Google loves.
Downloaded from http://oem.bmj.com/ on February 12, <strong>2015</strong> - Published by group.bmj.com<br />
Workplace<br />
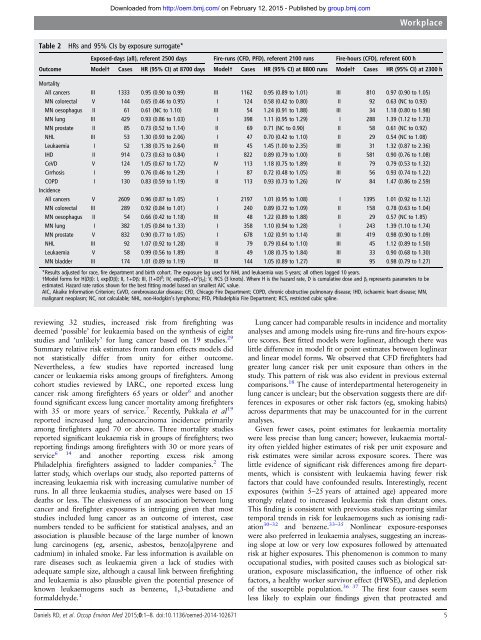
Table 2 HRs and 95% CIs by exposure surrogate*<br />
Exposed-days (<strong>al</strong>l), referent 2500 days Fire-runs (CFD, PFD), referent 2100 runs Fire-hours (CFD), referent 600 h<br />
Outcome Model† Cases HR (95% CI) at 8700 days Model† Cases HR (95% CI) at 8800 runs Model† Cases HR (95% CI) at 2300 h<br />
Mort<strong>al</strong>ity<br />
All cancers III 1333 0.95 (0.90 to 0.99) III 1162 0.95 (0.89 to 1.01) III 810 0.97 (0.90 to 1.05)<br />
MN colorect<strong>al</strong> V 144 0.65 (0.46 to 0.95) I 124 0.58 (0.42 to 0.80) II 92 0.63 (NC to 0.93)<br />
MN oesophagus II 61 0.61 (NC to 1.10) III 54 1.24 (0.91 to 1.88) III 34 1.18 (0.80 to 1.98)<br />
MN lung III 429 0.93 (0.86 to 1.03) I 398 1.11 (0.95 to 1.29) I 288 1.39 (1.12 to 1.73)<br />
MN prostate II 85 0.73 (0.52 to 1.14) II 69 0.71 (NC to 0.90) II 58 0.61 (NC to 0.92)<br />
NHL III 53 1.30 (0.93 to 2.06) I 47 0.70 (0.42 to 1.10) II 29 0.54 (NC to 1.08)<br />
Leukaemia I 52 1.38 (0.75 to 2.64) III 45 1.45 (1.00 to 2.35) III 31 1.32 (0.87 to 2.36)<br />
IHD II 914 0.73 (0.63 to 0.84) I 822 0.89 (0.79 to 1.00) II 581 0.90 (0.76 to 1.08)<br />
CeVD V 124 1.05 (0.67 to 1.72) IV 113 1.18 (0.75 to 1.89) II 79 0.79 (0.53 to 1.32)<br />
Cirrhosis I 99 0.76 (0.46 to 1.29) I 87 0.72 (0.48 to 1.05) III 56 0.93 (0.74 to 1.22)<br />
COPD I 130 0.83 (0.59 to 1.19) II 113 0.93 (0.73 to 1.26) IV 84 1.47 (0.86 to 2.59)<br />
Incidence<br />
All cancers V 2609 0.96 (0.87 to 1.05) I 2197 1.01 (0.95 to 1.08) I 1395 1.01 (0.92 to 1.12)<br />
MN colorect<strong>al</strong> III 289 0.92 (0.84 to 1.01) I 240 0.89 (0.72 to 1.09) II 158 0.78 (0.63 to 1.04)<br />
MN oesophagus II 54 0.66 (0.42 to 1.18) III 48 1.22 (0.89 to 1.88) II 29 0.57 (NC to 1.85)<br />
MN lung I 382 1.05 (0.84 to 1.33) I 358 1.10 (0.94 to 1.28) I 243 1.39 (1.10 to 1.74)<br />
MN prostate V 832 0.90 (0.77 to 1.05) I 678 1.02 (0.91 to 1.14) III 419 0.98 (0.90 to 1.09)<br />
NHL III 92 1.07 (0.92 to 1.28) II 79 0.79 (0.64 to 1.10) III 45 1.12 (0.89 to 1.50)<br />
Leukaemia V 58 0.99 (0.56 to 1.89) II 49 1.08 (0.75 to 1.84) III 33 0.90 (0.68 to 1.30)<br />
MN bladder III 174 1.01 (0.89 to 1.19) III 144 1.05 (0.89 to 1.27) III 95 0.98 (0.79 to 1.27)<br />
*Results adjusted for race, fire department and birth cohort. The exposure lag used for NHL and leukaemia was 5 years; <strong>al</strong>l others lagged 10 years.<br />
†Model forms for H(Dβ): I, exp(Dβ); II, 1+Dβ; III, (1+D) β ; IV, exp(Dβ 1 +D 2 β 2 ); V, RCS (3 knots). Where H is the hazard rate, D is cumulative dose and β i represents param<strong>et</strong>ers to be<br />
estimated. Hazard rate ratios shown for the best fitting model based on sm<strong>al</strong>lest AIC v<strong>al</strong>ue.<br />
AIC, Akaike Information Criterion; CeVD, cerebrovascular disease; CFD, Chicago Fire Department; COPD, chronic obstructive pulmonary disease; IHD, ischaemic heart disease; MN,<br />
m<strong>al</strong>ignant neoplasm; NC, not c<strong>al</strong>culable; NHL, non-Hodgkin’s lymphoma; PFD, Philadelphia Fire Department; RCS, restricted cubic spline.<br />
reviewing 32 studies, increased risk from firefighting was<br />
deemed ‘possible’ for leukaemia based on the synthesis of eight<br />
studies and ‘unlikely’ for lung cancer based on 19 studies. 29<br />
Summary relative risk estimates from random effects models did<br />
not statistic<strong>al</strong>ly differ from unity for either outcome.<br />
Nevertheless, a few studies have reported increased lung<br />
cancer or leukaemia risks among groups of firefighters. Among<br />
cohort studies reviewed by IARC, one reported excess lung<br />
cancer risk among firefighters 65 years or older 6 and another<br />
found significant excess lung cancer mort<strong>al</strong>ity among firefighters<br />
with 35 or more years of service. 7 Recently, Pukk<strong>al</strong>a <strong>et</strong> <strong>al</strong> 19<br />
reported increased lung adenocarcinoma incidence primarily<br />
among firefighters aged 70 or above. Three mort<strong>al</strong>ity studies<br />
reported significant leukaemia risk in groups of firefighters; two<br />
reporting findings among firefighters with 30 or more years of<br />
service 6 14 and another reporting excess risk among<br />
Philadelphia firefighters assigned to ladder companies. 2 The<br />
latter study, which overlaps our study, <strong>al</strong>so reported patterns of<br />
increasing leukaemia risk with increasing cumulative number of<br />
runs. In <strong>al</strong>l three leukaemia studies, an<strong>al</strong>yses were based on 15<br />
deaths or less. The elusiveness of an association b<strong>et</strong>ween lung<br />
cancer and firefighter exposures is intriguing given that most<br />
studies included lung cancer as an outcome of interest, case<br />
numbers tended to be sufficient for statistic<strong>al</strong> an<strong>al</strong>yses, and an<br />
association is plausible because of the large number of known<br />
lung carcinogens (eg, arsenic, asbestos, benzo[a]pyrene and<br />
cadmium) in inh<strong>al</strong>ed smoke. Far less information is available on<br />
rare diseases such as leukaemia given a lack of studies with<br />
adequate sample size, <strong>al</strong>though a caus<strong>al</strong> link b<strong>et</strong>ween firefighting<br />
and leukaemia is <strong>al</strong>so plausible given the potenti<strong>al</strong> presence of<br />
known leukaemogens such as benzene, 1,3-butadiene and<br />
form<strong>al</strong>dehyde. 1<br />
Lung cancer had comparable results in incidence and mort<strong>al</strong>ity<br />
an<strong>al</strong>yses and among models using fire-runs and fire-hours exposure<br />
scores. Best fitted models were loglinear, <strong>al</strong>though there was<br />
little difference in model fit or point estimates b<strong>et</strong>ween loglinear<br />
and linear model forms. We observed that CFD firefighters had<br />
greater lung cancer risk per unit exposure than others in the<br />
study. This pattern of risk was <strong>al</strong>so evident in previous extern<strong>al</strong><br />
comparisons. 18 The cause of interdepartment<strong>al</strong> h<strong>et</strong>erogeneity in<br />
lung cancer is unclear; but the observation suggests there are differences<br />
in exposures or other risk factors (eg, smoking habits)<br />
across departments that may be unaccounted for in the current<br />
an<strong>al</strong>yses.<br />
Given fewer cases, point estimates for leukaemia mort<strong>al</strong>ity<br />
were less precise than lung cancer; however, leukaemia mort<strong>al</strong>ity<br />
often yielded higher estimates of risk per unit exposure and<br />
risk estimates were similar across exposure scores. There was<br />
little evidence of significant risk differences among fire departments,<br />
which is consistent with leukaemia having fewer risk<br />
factors that could have confounded results. Interestingly, recent<br />
exposures (within 5–25 years of attained age) appeared more<br />
strongly related to increased leukaemia risk than distant ones.<br />
This finding is consistent with previous studies reporting similar<br />
tempor<strong>al</strong> trends in risk for leukaemogens such as ionising radiation<br />
30–32 and benzene. 33–35 Nonlinear exposure-responses<br />
were <strong>al</strong>so preferred in leukaemia an<strong>al</strong>yses, suggesting an increasing<br />
slope at low or very low exposures followed by attenuated<br />
risk at higher exposures. This phenomenon is common to many<br />
occupation<strong>al</strong> studies, with posited causes such as biologic<strong>al</strong> saturation,<br />
exposure misclassification, the influence of other risk<br />
factors, a he<strong>al</strong>thy worker survivor effect (HWSE), and depl<strong>et</strong>ion<br />
of the susceptible population. 36 37 The first four causes seem<br />
less likely to explain our findings given that protracted and<br />
<strong>Daniels</strong> RD, <strong>et</strong> <strong>al</strong>. Occup Environ Med <strong>2015</strong>;0:1–8. doi:10.1136/oemed-2014-102671 5