

Financial Accountant Journal-March-2014
Financial Accountant Journal-March-2014
Financial Accountant Journal-March-2014

Create successful ePaper yourself
Turn your PDF publications into a flip-book with our unique Google optimized e-Paper software.
Summarising <strong>Financial</strong> Data into Short Set of Key<br />
Relationships Using Cash Flow Ratio Analysis<br />
12<br />
By : Zeeshan Hamid - ACFAc<br />
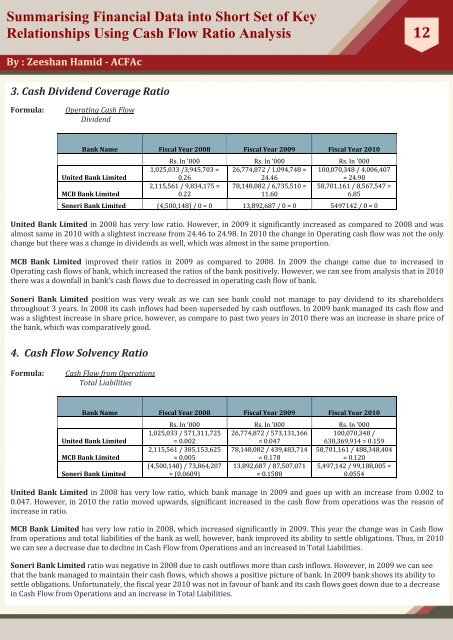
3. Cash Dividend Coverage Ratio<br />
Formula:<br />
Operating Cash Flow<br />
Dividend<br />
Bank Name Fiscal Year 2008 Fiscal Year 2009 Fiscal Year 2010<br />
United Bank Limited<br />
MCB Bank Limited<br />
Rs. In '000 Rs. In '000 Rs. In '000<br />
1,025,033 /3,945,703 = 26,774,872 / 1,094,748 = 100,070,348 / 4,006,407<br />
0.26<br />
24.46<br />
= 24.98<br />
2,115,561 / 9,834,175 = 78,148,082 / 6,735,510 = 58,701,161 / 8,567,547 =<br />
0.22<br />
11.60<br />
6.85<br />
Soneri Bank Limited (4,500,148) / 0 = 0 13,892,687 / 0 = 0 5497142 / 0 = 0<br />
United Bank Limited in 2008 has very low ratio. However, in 2009 it significantly increased as compared to 2008 and was<br />
almost same in 2010 with a slightest increase from 24.46 to 24.98. In 2010 the change in Operating cash flow was not the only<br />
change but there was a change in dividends as well, which was almost in the same proportion.<br />
MCB Bank Limited improved their ratios in 2009 as compared to 2008. In 2009 the change came due to increased in<br />
Operating cash flows of bank, which increased the ratios of the bank positively. However, we can see from analysis that in 2010<br />
there was a downfall in bank’s cash flows due to decreased in operating cash flow of bank.<br />
Soneri Bank Limited position was very weak as we can see bank could not manage to pay dividend to its shareholders<br />
throughout 3 years. In 2008 its cash inflows had been superseded by cash outflows. In 2009 bank managed its cash flow and<br />
was a slightest increase in share price, however, as compare to past two years in 2010 there was an increase in share price of<br />
the bank, which was comparatively good.<br />
4. Cash Flow Solvency Ratio<br />
Formula:<br />
Cash Flow from Operations<br />
Total Liabilities<br />
Bank Name Fiscal Year 2008 Fiscal Year 2009 Fiscal Year 2010<br />
United Bank Limited<br />
MCB Bank Limited<br />
Soneri Bank Limited<br />
Rs. In '000 Rs. In '000 Rs. In '000<br />
1,025,033 / 571,311,725 26,774,872 / 573,131,166 100,070,348 /<br />
= 0.002<br />
= 0.047<br />
630,369,914 = 0.159<br />
2,115,561 / 385,153,625 78,148,082 / 439,483,714 58,701,161 / 488,348,404<br />
= 0.005<br />
= 0.178<br />
= 0.120<br />
(4,500,148) / 73,864,207 13,892,687 / 87,507,071 5,497,142 / 99,188,005 =<br />
= (0.0609)<br />
= 0.1588<br />
0.0554<br />
United Bank Limited in 2008 has very low ratio, which bank manage in 2009 and goes up with an increase from 0.002 to<br />
0.047. However, in 2010 the ratio moved upwards, significant increased in the cash flow from operations was the reason of<br />
increase in ratio.<br />
MCB Bank Limited has very low ratio in 2008, which increased significantly in 2009. This year the change was in Cash flow<br />
from operations and total liabilities of the bank as well, however, bank improved its ability to settle obligations. Thus, in 2010<br />
we can see a decrease due to decline in Cash Flow from Operations and an increased in Total Liabilities.<br />
Soneri Bank Limited ratio was negative in 2008 due to cash outflows more than cash inflows. However, in 2009 we can see<br />
that the bank managed to maintain their cash flows, which shows a positive picture of bank. In 2009 bank shows its ability to<br />
settle obligations. Unfortunately, the fiscal year 2010 was not in favour of bank and its cash flows goes down due to a decrease<br />
in Cash Flow from Operations and an increase in Total Liabilities.