Region 6.4 Prevalence of Malaria per 100,000 Population by Region Malaria cases 2007 2006 2005 2004 2003 2002 Prevalen ce per 100,000 Malaria cases Prevalence per 100,000 Malaria cases Prevalence per 100,000 Malaria cases Prevalence per 100,000 Malaria cases Prevalenc e per 100,000 Malaria cases Prevalence per 100,000 Ashanti 750,450 16,437 856,301 19,393 800,698 18,750 663,456 16,065 674,831 16,896 659,484 17,073 Brong Ahafo 725,057 33,599 730,879 34,716 595,992 29,017 534,560 26,676 479,273 24,515 461,652 24,204 Central 312,279 16,940 262,517 14,540 154,103 8,714 175,433 10,129 224,597 13,240 235,044 14,147 Eastern 251,140 10,816 234,869 10,256 393,598 17,429 293,522 13,179 293,876 13,380 267,143 12,333 Greater Accra 427,888 10,894 443,061 11,776 472,146 13,101 400,378 11,599 399,261 12,075 396,913 12,533 Northern 195,531 8,851 274,019 12,751 301,489 14,423 255,544 12,567 253,326 12,807 227,703 11,834 Upper East 225,380 22,690 237,114 24,133 276,786 28,481 236,871 24,642 253,730 26,686 270,708 28,785 Upper West 105,135 16,205 117,048 18,347 110,092 17,550 101,547 16,463 128,882 21,250 77,941 13,070 Volta 239,529 12,838 224,987 12,288 301,246 16,766 315,242 17,878 333,375 19,266 275,327 16,213 Western 398,522 16,610 480,553 20,669 393,008 17,445 402,974 18,460 318,040 15,035 269,085 13,128 National 3,630,911 15,833 3,861,348 18,032 3,799,158 17,513 3,379,527 16,015 2,259,191 16,363 3,141,000 15,726 Region Malaria cases 2001 2000 1999 1998 1997 1996 Prevalence per 100,000 Malaria cases Prevalen ce per 100,000 Malaria cases Prevalence per 100,000 Malaria cases Prevalen ce per 100,000 Malaria cases Prevalenc e per 100,000 Malaria cases Prevalenc e per 100,000 Ashanti 561,111 15,020 488,373 13,517 546,781 15,667 318,141 9,436 367,752 11,292 334,548 10,634 Brong Ahafo 467,372 25,117 434,231 23,919 325,888 18,412 311,281 18,037 325,285 19,332 294,730 17,965 Central 50,608 3,110 176,464 11,072 166,591 10,676 154,772 10,132 150,816 10,085 125,137 8,547 Eastern 332,908 15,584 272,388 12,930 200,587 9,657 235,652 11,506 255,560 11,169 184,037 9,243 Greater Accra 359,917 11,864 252,900 8,704 252,769 9,099 259,110 9,757 260,135 10,246 278,819 11,488 Northern 301,783 16,123 326,367 17,924 220,336 12,450 125,014 7,267 124,057 7,419 100,455 6,181 Upper East 206,970 22,250 216,487 23,529 117,061 12,864 108,936 12,105 78,226 8,789 83,321 9,465 Upper West 101,083 17,238 104,963 18,204 88,230 15,567 62,588 11,234 57,866 10,566 56,254 10,449 Volta 306,370 18,384 64,842 3,965 92,366 5,757 182,855 11,618 211,320 13,687 160,410 10,591 Western 356,722 17,960 233,219 12,118 248,418 13,334 243,029 13,476 219,140 12,553 192,022 11,364 National 3,044,844 15,667 2,570,234 13,590 2,259,027 12,284 2,001,378 11,191 2,020,157 11,615 1,809,733 10,697 Source: CHIM/PPME-GHS 26
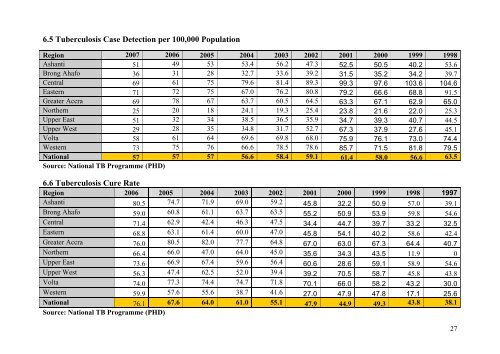
6.5 Tuberculosis Case Detection per 100,000 Population Region 2007 2006 2005 2004 2003 2002 2001 2000 1999 1998 Ashanti 51 49 53 53.4 56.2 47.3 52.5 50.5 40.2 53.6 Brong Ahafo 36 31 28 32.7 33.6 39.2 31.5 35.2 34.2 39.7 Central 69 61 75 79.6 81.4 89.3 99.3 97.6 103.6 104.6 Eastern 71 72 75 67.0 76.2 80.8 79.2 66.6 68.8 91.5 Greater Accra 69 78 67 63.7 60.5 64.5 63.3 67.1 62.9 65.0 Northern 25 20 18 24.1 19.3 25.4 23.8 21.6 22.0 25.3 Upper East 51 32 34 38.5 36.5 35.9 34.7 39.3 40.7 44.5 Upper West 29 28 35 34.8 31.7 52.7 67.3 37.9 27.6 45.1 Volta 58 61 64 69.6 69.8 68.0 75.9 76.1 73.0 74.4 Western 73 75 76 66.6 78.5 78.6 85.7 71.5 81.8 79.5 National 57 57 57 56.6 58.4 59.1 61.4 58.0 56.6 63.5 Source: National TB Programme (PHD) 6.6 Tuberculosis Cure Rate Region 2006 2005 2004 2003 2002 2001 2000 1999 1998 1997 Ashanti 80.5 74.7 71.9 69.0 59.2 45.8 32.2 50.9 57.0 39.1 Brong Ahafo 59.0 60.8 61.1 63.7 63.5 55.2 50.9 53.9 59.8 54.6 Central 71.4 62.9 42.4 46.3 47.5 34.4 44.7 39.7 33.2 32.5 Eastern 68.8 63.1 61.4 60.0 47.0 45.8 54.1 40.2 58.6 42.4 Greater Accra 76.0 80.5 82.0 77.7 64.8 67.0 63.0 67.3 64.4 40.7 Northern 66.4 66.0 47.0 64.0 45.0 35.6 34.3 43.5 11.9 0 Upper East 73.6 66.9 67.4 59.6 56.4 60.6 28.6 59.1 58.9 54.6 Upper West 56.3 47.4 62.5 52.0 39.4 39.2 70.5 58.7 45.8 43.8 Volta 74.0 77.3 74.4 74.7 71.8 70.1 66.0 58.2 43.2 30.0 Western 59.9 57.6 55.6 38.7 41.6 27.0 47.9 47.8 17.1 25.6 National 76.1 67.6 64.0 61.0 55.1 47.9 44.9 49.3 43.8 38.1 Source: National TB Programme (PHD) 27