FINANCIAL SECTION
FINANCIAL SECTION
FINANCIAL SECTION

Create successful ePaper yourself
Turn your PDF publications into a flip-book with our unique Google optimized e-Paper software.
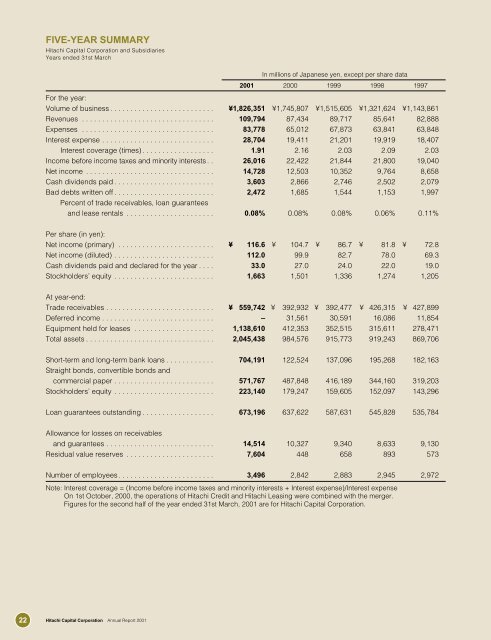
FIVE-YEAR SUMMARY<br />
Hitachi Capital Corporation and Subsidiaries<br />
Years ended 31st March<br />
In millions of Japanese yen, except per share data<br />
2001 2000 1999 1998 1997<br />
For the year:<br />
Volume of business . . . . . . . . . . . . . . . . . . . . . . . . . . ¥1,826,351 ¥1,745,807 ¥1,515,605 ¥1,321,624 ¥1,143,861<br />
Revenues . . . . . . . . . . . . . . . . . . . . . . . . . . . . . . . . . 109,794 87,434 89,717 85,641 82,888<br />
Expenses . . . . . . . . . . . . . . . . . . . . . . . . . . . . . . . . . 83,778 65,012 67,873 63,841 63,848<br />
Interest expense . . . . . . . . . . . . . . . . . . . . . . . . . . . . 28,704 19,411 21,201 19,919 18,407<br />
Interest coverage (times) . . . . . . . . . . . . . . . . . . 1.91 2.16 2.03 2.09 2.03<br />
Income before income taxes and minority interests . . 26,016 22,422 21,844 21,800 19,040<br />
Net income . . . . . . . . . . . . . . . . . . . . . . . . . . . . . . . . 14,728 12,503 10,352 9,764 8,658<br />
Cash dividends paid . . . . . . . . . . . . . . . . . . . . . . . . . 3,603 2,866 2,746 2,502 2,079<br />
Bad debts written off . . . . . . . . . . . . . . . . . . . . . . . . . 2,472 1,685 1,544 1,153 1,997<br />
Percent of trade receivables, loan guarantees<br />
and lease rentals . . . . . . . . . . . . . . . . . . . . . . 0.08% 0.08% 0.08% 0.06% 0.11%<br />
Per share (in yen):<br />
Net income (primary) . . . . . . . . . . . . . . . . . . . . . . . . ¥ 116.6 ¥ 104.7 ¥ 86.7 ¥ 81.8 ¥ 72.8<br />
Net income (diluted) . . . . . . . . . . . . . . . . . . . . . . . . . 112.0 99.9 82.7 78.0 69.3<br />
Cash dividends paid and declared for the year . . . . 33.0 27.0 24.0 22.0 19.0<br />
Stockholders’ equity . . . . . . . . . . . . . . . . . . . . . . . . . 1,663 1,501 1,336 1,274 1,205<br />
At year-end:<br />
Trade receivables . . . . . . . . . . . . . . . . . . . . . . . . . . . ¥ 559,742 ¥ 392,932 ¥ 392,477 ¥ 426,315 ¥ 427,899<br />
Deferred income . . . . . . . . . . . . . . . . . . . . . . . . . . . . – 31,561 30,591 16,086 11,854<br />
Equipment held for leases . . . . . . . . . . . . . . . . . . . . 1,138,610 412,353 352,515 315,611 278,471<br />
Total assets . . . . . . . . . . . . . . . . . . . . . . . . . . . . . . . . 2,045,438 984,576 915,773 919,243 869,706<br />
Short-term and long-term bank loans . . . . . . . . . . . . 704,191 122,524 137,096 195,268 182,163<br />
Straight bonds, convertible bonds and<br />
commercial paper . . . . . . . . . . . . . . . . . . . . . . . . . 571,767 487,848 416,189 344,160 319,203<br />
Stockholders’ equity . . . . . . . . . . . . . . . . . . . . . . . . . 223,140 179,247 159,605 152,097 143,296<br />
Loan guarantees outstanding . . . . . . . . . . . . . . . . . . 673,196 637,622 587,631 545,828 535,784<br />
Allowance for losses on receivables<br />
and guarantees . . . . . . . . . . . . . . . . . . . . . . . . . . . 14,514 10,327 9,340 8,633 9,130<br />
Residual value reserves . . . . . . . . . . . . . . . . . . . . . . 7,604 448 658 893 573<br />
Number of employees. . . . . . . . . . . . . . . . . . . . . . . . 3,496 2,842 2,883 2,945 2,972<br />
Note: Interest coverage = (Income before income taxes and minority interests + Interest expense)/Interest expense<br />
On 1st October, 2000, the operations of Hitachi Credit and Hitachi Leasing were combined with the merger.<br />
Figures for the second half of the year ended 31st March, 2001 are for Hitachi Capital Corporation.<br />
22 Hitachi Capital Corporation Annual Report 2001