The Allison Unit CO2-ECBM Pilot - A Reservoir and ... - Coal-Seq
The Allison Unit CO2-ECBM Pilot - A Reservoir and ... - Coal-Seq
The Allison Unit CO2-ECBM Pilot - A Reservoir and ... - Coal-Seq

Create successful ePaper yourself
Turn your PDF publications into a flip-book with our unique Google optimized e-Paper software.
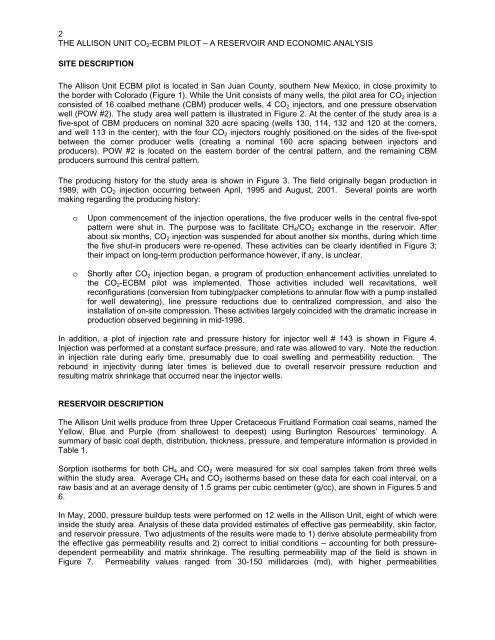
2<br />
THE ALLISON UNIT CO 2 -<strong>ECBM</strong> PILOT – A RESERVOIR AND ECONOMIC ANALYSIS<br />
SITE DESCRIPTION<br />
<strong>The</strong> <strong>Allison</strong> <strong>Unit</strong> <strong>ECBM</strong> pilot is located in San Juan County, southern New Mexico, in close proximity to<br />
the border with Colorado (Figure 1). While the <strong>Unit</strong> consists of many wells, the pilot area for CO 2 injection<br />
consisted of 16 coalbed methane (CBM) producer wells, 4 CO 2 injectors, <strong>and</strong> one pressure observation<br />
well (POW #2). <strong>The</strong> study area well pattern is illustrated in Figure 2. At the center of the study area is a<br />
five-spot of CBM producers on nominal 320 acre spacing (wells 130, 114, 132 <strong>and</strong> 120 at the corners,<br />
<strong>and</strong> well 113 in the center), with the four CO 2 injectors roughly positioned on the sides of the five-spot<br />
between the corner producer wells (creating a nominal 160 acre spacing between injectors <strong>and</strong><br />
producers). POW #2 is located on the eastern border of the central pattern, <strong>and</strong> the remaining CBM<br />
producers surround this central pattern.<br />
<strong>The</strong> producing history for the study area is shown in Figure 3. <strong>The</strong> field originally began production in<br />
1989, with CO 2 injection occurring between April, 1995 <strong>and</strong> August, 2001. Several points are worth<br />
making regarding the producing history:<br />
o<br />
o<br />
Upon commencement of the injection operations, the five producer wells in the central five-spot<br />
pattern were shut in. <strong>The</strong> purpose was to facilitate CH 4 /CO 2 exchange in the reservoir. After<br />
about six months, CO 2 injection was suspended for about another six months, during which time<br />
the five shut-in producers were re-opened. <strong>The</strong>se activities can be clearly identified in Figure 3;<br />
their impact on long-term production performance however, if any, is unclear.<br />
Shortly after CO 2 injection began, a program of production enhancement activities unrelated to<br />
the CO 2 -<strong>ECBM</strong> pilot was implemented. Those activities included well recavitations, well<br />
reconfigurations (conversion from tubing/packer completions to annular flow with a pump installed<br />
for well dewatering), line pressure reductions due to centralized compression, <strong>and</strong> also the<br />
installation of on-site compression. <strong>The</strong>se activities largely coincided with the dramatic increase in<br />
production observed beginning in mid-1998.<br />
In addition, a plot of injection rate <strong>and</strong> pressure history for injector well # 143 is shown in Figure 4.<br />
Injection was performed at a constant surface pressure, <strong>and</strong> rate was allowed to vary. Note the reduction<br />
in injection rate during early time, presumably due to coal swelling <strong>and</strong> permeability reduction. <strong>The</strong><br />
rebound in injectivity during later times is believed due to overall reservoir pressure reduction <strong>and</strong><br />
resulting matrix shrinkage that occurred near the injector wells.<br />
RESERVOIR DESCRIPTION<br />
<strong>The</strong> <strong>Allison</strong> <strong>Unit</strong> wells produce from three Upper Cretaceous Fruitl<strong>and</strong> Formation coal seams, named the<br />
Yellow, Blue <strong>and</strong> Purple (from shallowest to deepest) using Burlington Resources’ terminology. A<br />
summary of basic coal depth, distribution, thickness, pressure, <strong>and</strong> temperature information is provided in<br />
Table 1.<br />
Sorption isotherms for both CH 4 <strong>and</strong> CO 2 were measured for six coal samples taken from three wells<br />
within the study area. Average CH 4 <strong>and</strong> CO 2 isotherms based on these data for each coal interval, on a<br />
raw basis <strong>and</strong> at an average density of 1.5 grams per cubic centimeter (g/cc), are shown in Figures 5 <strong>and</strong><br />
6.<br />
In May, 2000, pressure buildup tests were performed on 12 wells in the <strong>Allison</strong> <strong>Unit</strong>, eight of which were<br />
inside the study area. Analysis of these data provided estimates of effective gas permeability, skin factor,<br />
<strong>and</strong> reservoir pressure. Two adjustments of the results were made to 1) derive absolute permeability from<br />
the effective gas permeability results <strong>and</strong> 2) correct to initial conditions – accounting for both pressuredependent<br />
permeability <strong>and</strong> matrix shrinkage. <strong>The</strong> resulting permeability map of the field is shown in<br />
Figure 7. Permeability values ranged from 30-150 millidarcies (md), with higher permeabilities