Vol 36, No. 1 - NAWC
Vol 36, No. 1 - NAWC
Vol 36, No. 1 - NAWC

Create successful ePaper yourself
Turn your PDF publications into a flip-book with our unique Google optimized e-Paper software.
Challenge, continued<br />
electric utility revenues. The electric utility<br />
revenues are $11 billion or 50% of<br />
their total net plant investment. The electric<br />
utilities revenues are nearly 28 times<br />
the revenues of water utilities.<br />
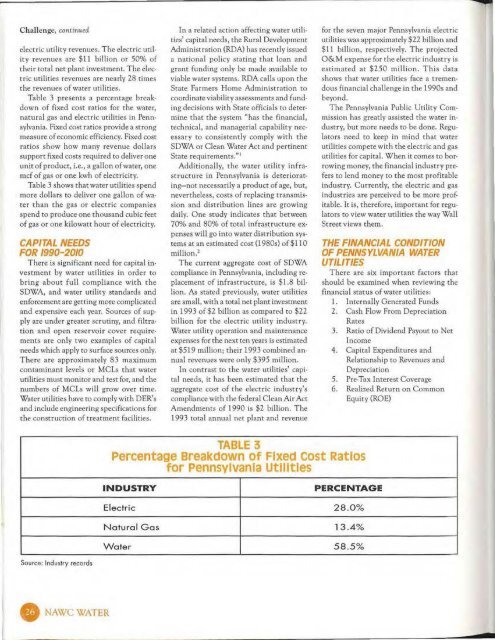
Table 3 presents a percentage breakdown<br />
of fixed cost ratios for the water,<br />
natural gas and electric utilities in Pennsylvania.<br />
Fixed cost ratios provide a strong<br />
measure of economic efficiency. Fixed cost<br />
ratios show how many revenue dollars<br />
support fixed costs required to deliver one<br />
unit of product, i.e., a gallon of water, one<br />
md of gas or one kwh of electricity.<br />
Table 3 shows that water utilities spend<br />
more dollars to deliver one gallo n of water<br />
than the gas or electric companies<br />
spend to produce one thousand cubic feet<br />
of gas or one kilowatt hour of electricity.<br />
CAPITAL NEEDS<br />
FOR 1990-2010<br />
There is significant need for capital investment<br />
by water utilities in order to<br />
brin g about full compliance with the<br />
SDWA, and water utility standards and<br />
enforcement are getting more complicated<br />
and expensive each year. Sources of supply<br />
are under greater scrutiny, and filtration<br />
and open reservoir cover requirements<br />
are only two examples of capital<br />
needs which apply to surface sources only.<br />
There are approxi mately 83 maximum<br />
contaminant levels o r MCLs that water<br />
utilities must monitor and test fo r, and the<br />
numbers of MCLs will grow over time.<br />
Water utilities have to comply with DER's<br />
and include engineering specifications for<br />
the construction of treatment facilities.<br />
In a related action affecting water utilities'<br />
capital needs, the Rural Development<br />
Administration (RDA) has recently issued<br />
a natio nal policy stating that loan and<br />
grant funding only be made available to<br />
v iable water systems. RDA calls upon the<br />
State Farmers Home Administration to<br />
coordinate viability assessments and funding<br />
decisions with State officials to determine<br />
that the system "has the financial,<br />
technica l, and managerial capability necessary<br />
to consistently comply with the<br />
SDWA or Clean Water Act and pertinent<br />
State requirements."l<br />
Additionally, the water utility infrastructure<br />
in Pennsylvania is deteriorat·<br />
ing- not necessarily a product of age, but,<br />
nevertheless, costs of replacing t ransmission<br />
and distribution lines are growing<br />
daily. One st udy indicates that between<br />
70% and 80% of total infrastructure ex·<br />
penses will go into water distribution systems<br />
at an estimated cosr(1980s) of$1 1 0<br />
million. 2<br />
The current aggregate cost of SDWA<br />
compliance in Pennsylvania, including replacement<br />
of infrastructure, is $1.8 billion.<br />
As stated previously, water utilities<br />
are small, with a total net plant investment<br />
in 1993 of$2 billion as compared to $22<br />
billion for the electric utilit y industry.<br />
Water utility operation and maintenance<br />
expenses for the next ten years is estimated<br />
at $519 million; their 1993 combined annual<br />
revenues were only $395 million.<br />
In contrast to the water utilities' capital<br />
needs, it has been estimated that the<br />
aggregate cost of the electric industry's<br />
compliance with the federal Clean Air Act<br />
Amendments of 1990 is $2 billion. The<br />
1993 total annual net plant and revenue<br />
for the seven major Pennsylvania electric<br />
utilities was approximately $22 billion and<br />
$1 1 billion, respectively. The projected<br />
O&M expense for the electric industry is<br />
estimated at $250 million. This data<br />
shows that water utilities face a tremendous<br />
financial challenge in the 1990s and<br />
beyond.<br />
The Pennsylvania Public Utility Commission<br />
has greatly assisted the water industry,<br />
but morc needs to be done. Regu·<br />
lators need to keep in mind that water<br />
utilities compete with the electric and gas<br />
utilities fot capital. When it comes to borrowing<br />
money, the financial industry pre·<br />
fers to lend money to the most profitable<br />
industry. C urrently, the electri c and gas<br />
industries are perceived to be more prof·<br />
itable. It is, therefore, important for regulators<br />
to view water utilities the way Wall<br />
Street views them.<br />
THE FINANCIAL CONDITION<br />
OF PENNSYLVANIA WATER<br />
UTILITIES<br />
There are six important factors that<br />
should be examined when reviewing the<br />
financial stat us of water utilities:<br />
1. Internally Generated Funds<br />
2. Cash Flow From Depreciation<br />
Rates<br />
3. Ratio of Dividend Payout to Net<br />
Income<br />
4. Capital Expenditures and<br />
Relationship to Revenues and<br />
Depreciation<br />
5. Pre-Tax Interest Cover age<br />
6. Realized Return on Common<br />
Equity (ROE)<br />
TABLE 3<br />
Percentage Breakdown of Fixed Cost RatiOS<br />
for pennsylvania Utilities<br />
INDUSTRY<br />
Electric<br />
PERCENTAGE<br />
28_0%<br />
Natura l Gas 13-4%<br />
Water 58.5 %<br />
Source: Industry records<br />
G <strong>NAWC</strong>WATER