Determinants of Child Nutritional Status in Zambia - Access-to-law.com
Determinants of Child Nutritional Status in Zambia - Access-to-law.com
Determinants of Child Nutritional Status in Zambia - Access-to-law.com

Create successful ePaper yourself
Turn your PDF publications into a flip-book with our unique Google optimized e-Paper software.
<strong>Determ<strong>in</strong>ants</strong> <strong>of</strong> <strong>Child</strong> <strong>Nutritional</strong> <strong>Status</strong> <strong>in</strong> <strong>Zambia</strong>: An Analysis <strong>of</strong> a National<br />
Survey<br />
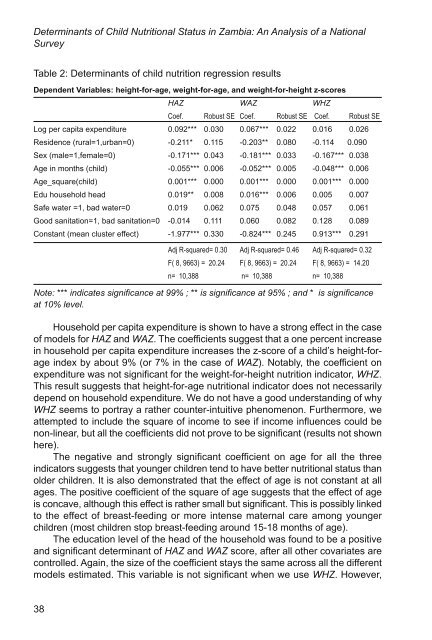
Table 2: <strong>Determ<strong>in</strong>ants</strong> <strong>of</strong> child nutrition regression results<br />
Dependent Variables: height-for-age, weight-for-age, and weight-for-height z-scores<br />
HAZ WAZ WHZ<br />
Coef. Robust SE Coef. Robust SE Coef. Robust SE<br />
Log per capita expenditure 0.092*** 0.030 0.067*** 0.022 0.016 0.026<br />
Residence (rural=1,urban=0) -0.211* 0.115 -0.203** 0.080 -0.114 0.090<br />
Sex (male=1,female=0) -0.171*** 0.043 -0.181*** 0.033 -0.167*** 0.038<br />
Age <strong>in</strong> months (child) -0.055*** 0.006 -0.052*** 0.005 -0.048*** 0.006<br />
Age_square(child) 0.001*** 0.000 0.001*** 0.000 0.001*** 0.000<br />
Edu household head 0.019** 0.008 0.016*** 0.006 0.005 0.007<br />
Safe water =1, bad water=0 0.019 0.062 0.075 0.048 0.057 0.061<br />
Good sanitation=1, bad sanitation=0 -0.014 0.111 0.060 0.082 0.128 0.089<br />
Constant (mean cluster effect) -1.977*** 0.330 -0.824*** 0.245 0.913*** 0.291<br />
Adj R-squared= 0.30 Adj R-squared= 0.46 Adj R-squared= 0.32<br />
F( 8, 9663) = 20.24 F( 8, 9663) = 20.24 F( 8, 9663) = 14.20<br />
n= 10,388 n= 10,388 n= 10,388<br />
Note: *** <strong>in</strong>dicates significance at 99% ; ** is significance at 95% ; and * is significance<br />
at 10% level.<br />
Household per capita expenditure is shown <strong>to</strong> have a strong effect <strong>in</strong> the case<br />
<strong>of</strong> models for HAZ and WAZ. The coefficients suggest that a one percent <strong>in</strong>crease<br />
<strong>in</strong> household per capita expenditure <strong>in</strong>creases the z-score <strong>of</strong> a child’s height-forage<br />
<strong>in</strong>dex by about 9% (or 7% <strong>in</strong> the case <strong>of</strong> WAZ). Notably, the coefficient on<br />
expenditure was not significant for the weight-for-height nutrition <strong>in</strong>dica<strong>to</strong>r, WHZ.<br />
This result suggests that height-for-age nutritional <strong>in</strong>dica<strong>to</strong>r does not necessarily<br />
depend on household expenditure. We do not have a good understand<strong>in</strong>g <strong>of</strong> why<br />
WHZ seems <strong>to</strong> portray a rather counter-<strong>in</strong>tuitive phenomenon. Furthermore, we<br />
attempted <strong>to</strong> <strong>in</strong>clude the square <strong>of</strong> <strong>in</strong><strong>com</strong>e <strong>to</strong> see if <strong>in</strong><strong>com</strong>e <strong>in</strong>fluences could be<br />
non-l<strong>in</strong>ear, but all the coefficients did not prove <strong>to</strong> be significant (results not shown<br />
here).<br />
The negative and strongly significant coefficient on age for all the three<br />
<strong>in</strong>dica<strong>to</strong>rs suggests that younger children tend <strong>to</strong> have better nutritional status than<br />
older children. It is also demonstrated that the effect <strong>of</strong> age is not constant at all<br />
ages. The positive coefficient <strong>of</strong> the square <strong>of</strong> age suggests that the effect <strong>of</strong> age<br />
is concave, although this effect is rather small but significant. This is possibly l<strong>in</strong>ked<br />
<strong>to</strong> the effect <strong>of</strong> breast-feed<strong>in</strong>g or more <strong>in</strong>tense maternal care among younger<br />
children (most children s<strong>to</strong>p breast-feed<strong>in</strong>g around 15-18 months <strong>of</strong> age).<br />
The education level <strong>of</strong> the head <strong>of</strong> the household was found <strong>to</strong> be a positive<br />
and significant determ<strong>in</strong>ant <strong>of</strong> HAZ and WAZ score, after all other covariates are<br />
controlled. Aga<strong>in</strong>, the size <strong>of</strong> the coefficient stays the same across all the different<br />
models estimated. This variable is not significant when we use WHZ. However,<br />
38