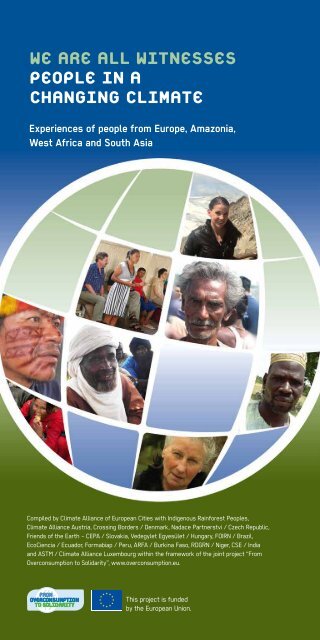
WE ARE ALL WITNESSES - PEOPLE IN A CHANGING CLIMATE
The 24 panels of the "We are all witnesses - People in a Changing Climate" exhibition illustrate how climate change is already taking place in 16 countries in four countries.
The 24 panels of the "We are all witnesses - People in a Changing Climate" exhibition illustrate how climate change is already taking place in 16 countries in four countries.

Create successful ePaper yourself
Turn your PDF publications into a flip-book with our unique Google optimized e-Paper software.
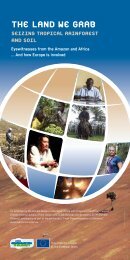
<strong>WE</strong> <strong>ARE</strong> <strong>ALL</strong> <strong>WITNESSES</strong><br />
<strong>PEOPLE</strong> <strong>IN</strong> A<br />
CHANG<strong>IN</strong>G <strong>CLIMATE</strong><br />
Experiences of people from Europe, Amazonia,<br />
West Africa and South Asia<br />
Compiled by Climate Alliance of European Cities with Indigenous Rainforest Peoples,<br />
Climate Alliance Austria, Crossing Borders / Denmark, Nadace Partnerstvi / Czech Republic,<br />
Friends of the Earth – CEPA / Slovakia, Vedegylet Egyesület / Hungary, FOIRN / Brazil,<br />
EcoCiencia / Ecuador, Formabiap / Peru, ARFA / Burkina Faso, RDGRN / Niger, CSE / India<br />
and ASTM / Climate Alliance Luxembourg within the framework of the joint project “From<br />
Overconsumption to Solidarity”, www.overconsumption.eu.<br />
This project is funded<br />
by the European Union.
Content<br />
We are all witnesses<br />
People in a<br />
changing climate<br />
Introduction<br />
1 Front page<br />
2 Content and Impressum<br />
3 Climate Change happens:The newest findings of science<br />
Testimonies from four continents<br />
4+5 Aqqaluk Lynge and Inuuteq Holm Olsen from Greenland<br />
6 Palle Madsen from Denmark<br />
7 Stepanka Hanzlikova from Czech Republic<br />
8 Jozef Páleník from Slovakia<br />
9 Szép Gyöngyvér from Hungary<br />
10+11 Olmedo Cayambe and Maria Ushca from Ecuador<br />
12+13 André Baniwa and Almerinda Ramos de Lima from Rio Negro / Brazil<br />
14 Aurelio Chino Dahua from Peru<br />
15 Diego Escobar from Amazonia<br />
16-18 Yempabou Lankoande, Ousséni Sayaogo and Mahamadi Sawadogo from Burkina Faso<br />
19+20 Jobari Mokao and Finda Lompo from Niger<br />
21-23 Ram Singh and Ringchen from India<br />
24 Shadu Charan Mondol from Bangladesh<br />
25 Jeff Rohen from Luxembourg<br />
26 Anna Pirpamer from Austria<br />
27 Joachim Lorenz from Germany<br />
Conclusions<br />
28 Common but differentiated responsibilities<br />
29 Who emitted the carbon dioxide…?<br />
30 What you can do<br />
Publisher<br />
ASTM / Climate Alliance Luxembourg<br />
Editor: Dietmar Mirkes<br />
www.astm.lu, www.klimabuendnis.lu<br />
Luxembourg, October 2013<br />
Further information at www.overconsumption.eu<br />
This publication has been<br />
produced with the assistance of<br />
the European Union in the project<br />
“From Overconsumption to Solidarity”.<br />
The contents of this publication are<br />
the sole responsibility of ASTM /<br />
Climate Alliance Luxembourg and can<br />
in no way be taken to reflect the views<br />
of the European Union.
The newest<br />
findings of<br />
science:<br />
Climate Change<br />
is happening<br />
The International Panel on Climate Change (IPCC, www.ipcc.ch) report of 27<br />
September 2013 states: “Warming in the climate system is unequivocal.” It goes<br />
on to say: “It is extremely likely that human influence has been the dominant<br />
cause of the observed warming since the mid-20th century”. Improved climate<br />
models, data and observations make it clear that many of the effects of warming<br />
are accelerating or happening faster than predicted in previous reports. Here, by<br />
way of illustration are two examples relating to the water cycles:<br />
Cryosphere:<br />
Arctic summer sea ice extent (in million km 2 )<br />
14<br />
12<br />
10<br />
8<br />
6<br />
4<br />
1900 1910 1920 1930 1940 1950 1960 1970 1980 1990 2000 2010 2020<br />
Worldwide, the ice sheets and glaciers<br />
are losing mass. The annual<br />
mean Arctic sea ice extent decreased<br />
between 1979 and 2012 very<br />
likely with a rate of 4 % per decade.<br />
During the last two decades, the<br />
Greenland Ice Sheet has lost mass,<br />
from 2002 to 2011 even much faster<br />
than from 1992 to 2001.<br />
Sea Level:<br />
Global average sea level rise (in mm)<br />
200<br />
150<br />
100<br />
50<br />
0<br />
-50<br />
1900 1910 1920 1930 1940 1950 1960 1970 1980 1990 2000 2010 2020<br />
Ocean warming dominates the increase<br />
in energy stored in the climate<br />
system (more than 90% since 1971).<br />
Since the early 1970s, glacier mass<br />
loss and ocean thermal expansion together<br />
explain about 75% of the global<br />
mean sea level rise. Over the period<br />
1901-2010, global mean sea level rose<br />
by 0,19 m. The rising rate of 1,7 mm<br />
per year between 1901 and 2010 nearly<br />
doubled between 1993 and 2010 to<br />
3,2 mm. This is faster than estimated<br />
in the 4th report.<br />
Data sources on the following country panels<br />
The following 24 panels illustrate how<br />
climate change is already taking place<br />
in 16 countries on four continents. For<br />
this purpose we have put together a<br />
number of personal testimonies and<br />
natural phenomena, all of which are<br />
in line with the 2007 IPCC projections<br />
and the new findings of 2013. The panels<br />
focus on the implications of climate<br />
change for the water cycle.<br />
In order to show the extent of each<br />
country’s contribution to the problem,<br />
we have added the 2010 figures<br />
for CO 2<br />
e emissions from the Joint Research<br />
Centre of the European Commission<br />
and the Netherlands Environmental<br />
Assessment Agency (http://<br />
edgar.jrc.ec.europa.eu/overview.<br />
php?v=GHGts1990-2010, up-dated<br />
17.9.2013). Those figures include other<br />
greenhouse gases converted into CO 2<br />
equivalents and emissions resulting<br />
from large-scale biomass burning (e.g.<br />
forest fires) and are divided by the<br />
2010 population figures from the Human<br />
Development Report 2010.<br />
In order to show which countries’ populations<br />
suffer most from the consequences<br />
of climate change, we have<br />
indicated their degree of risk as stated<br />
in the 2012 WorldRiskReport. This is<br />
based on the extent of a population’s<br />
exposure to natural hazards such as<br />
storms, floods, droughts, sea level rise<br />
and earthquakes as well as the vulnerability<br />
of that population, which is the<br />
sum of susceptibility, lack of coping capacities<br />
and lack of adaptive capacities.<br />
Weitere Informationen: www.overconsumption.eu
Greenland 1:<br />
melting<br />
ice ...<br />
Aqqaluk Lynge,<br />
former president of the Inuit<br />
Circumpolar Council.<br />
Hunter in<br />
the region of<br />
Ilulissat, West<br />
Greenland<br />
© Inuit Circumpolar Council<br />
© David Trood, Ilulissat 23, flickr /ilovegreenland<br />
“Hunting is an integral part of<br />
Inuit way of life. In recent years,<br />
the number of hunters has<br />
dropped by more than half. Marine<br />
species such as walrus, polar<br />
bears, narwhals, and seals are<br />
moving away from areas in which<br />
they were traditionally hunted,<br />
as they respond to pressures in<br />
local ecosystems. Polar bears for<br />
example are now being seen around<br />
towns and settlements for the first<br />
time. Traditional hunters that use<br />
dog sleds now have to use land<br />
instead of sea ice and the hunters<br />
have to go further out for game. Yet,<br />
it is increasingly more dangerous<br />
to do so with the rising frequency<br />
of storms. This is a very real threat<br />
to hunters that live off traditional<br />
hunting. Hunting communities are<br />
facing increasing uncertainty on all<br />
levels of their existence, and their<br />
hunters are turning to the growing<br />
tourism industry — a side effect<br />
of global warming — and other<br />
coping strategies to maintain their<br />
local subsistence activities and to<br />
reinforce their own culture.”<br />
SCIENTIFIC BACKGROUND<br />
The Arctic climate has changed at an alarming rate over the last fifty<br />
years. Arctic glaciers and ice streams are narrowing and flowing at a faster<br />
rate. The extent of annual average sea ice has greatly diminished, with<br />
scientists predicting that sea ice in the Arctic may disappear entirely by the<br />
end of the 21st century (IPCC 2007). The decrease in extent and volume of<br />
Arctic Sea ice has exceeded previous projections. In 2007, 2011, and 2012,<br />
record low sea ice cover was observed, exhibiting roughly half the size of<br />
the normal minimum extent of the 1980s.<br />
Greenland<br />
CO 2<br />
e emissions<br />
in tons per<br />
capita in 2010<br />
WorldRiskIndex<br />
2012<br />
15<br />
14<br />
13<br />
12<br />
11<br />
10<br />
9<br />
8<br />
7<br />
6<br />
5<br />
4<br />
3<br />
2<br />
1<br />
0<br />
EU27<br />
10.0<br />
World<br />
7.3<br />
Greenland<br />
4.3<br />
NO DATA AVAILABLE<br />
Further information at www.overconsumption.eu
Greenland 2:<br />
... on land<br />
and sea<br />
Hunter,<br />
close to Ilulissat, Central Western<br />
coast of Greenland<br />
Serminnguaq<br />
(“little glacier”),<br />
Kangerlussuaq<br />
Fjord, West<br />
Greenland.<br />
© David Trood, Ilulissat 16, flickr /ilovegreenland<br />
© Arne Hardenberg, flickr /ilovegreenland<br />
“Our ancestors have lived in<br />
these vast regions for thousands<br />
of years, adapting to one of the<br />
most severe climates of the<br />
planet, living off the resources<br />
that nature could supply. When<br />
the sea ice grows, you can<br />
use that for many things, like<br />
transportation. But the sea ice<br />
hasn’t been there for the last<br />
seven to eight years. You don’t<br />
see the sea ice freezing anymore.<br />
As the permafrost melts, the<br />
roads and airports become<br />
unstable, causing damage to<br />
infrastructure. We are also<br />
experiencing much more violent<br />
storms with hurricane force<br />
winds and rains that melt all the<br />
snow.”<br />
Inuuteq Holm Olsen, Deputy<br />
Foreign Minister of Greenland’s<br />
Home Rule Government, Plenty<br />
2008.<br />
SCIENTIFIC BACKGROUND<br />
The Greenland ice sheet is the largest<br />
body of ice in the northern hemisphere. It<br />
influences the global climate by its direct<br />
link to global sea level and by its effects on<br />
ocean temperatures, salinity and circulation.<br />
The Greenland ice sheet has been melting<br />
at an accelerating rate since the 1990s.<br />
Since 2006, high summer melt rates have<br />
led to a Greenland ice sheet mass loss of<br />
273 billion tonnes a year. An exceptional<br />
melting was recorded by scientists in<br />
2012. Most recently, the Greenland ice<br />
sheet is estimated to contribute up to 0.7<br />
millimeters to global sea-level each year.<br />
Model projections indicate the Greenland<br />
ice sheet will undergo further decline,<br />
though the processes determining the rate<br />
of change are still not well understood.<br />
The ‘tipping point’ at which the Greenland<br />
ice sheet will completely melt is projected<br />
at a global temperature rise of about 3<br />
degrees C, though this estimate is subject<br />
to uncertainty (European Environment<br />
Agency, 2012).<br />
Greenland<br />
ice mass<br />
loss from<br />
2003 to<br />
2011 in<br />
centimeters.<br />
Source: http://www.<br />
nasa.gov/mission_pages/<br />
Grace/multimedia/<br />
pia13955b.html<br />
0<br />
-20<br />
-40<br />
-60<br />
-80<br />
-100<br />
-120<br />
-140<br />
Further information at www.overconsumption.eu
© Joseph O’Brien, USDA Forest Service, Bugwood.org<br />
Denmark:<br />
A lovely land<br />
is ours / With<br />
beeches green<br />
about her /<br />
Encircled by<br />
the sea.<br />
Palle Madsen,<br />
Senior researcher, Department of<br />
Geosciences and Natural Resource<br />
Management, University of<br />
Copenhagen<br />
Examining a<br />
snapped beech<br />
affected by<br />
beech bark<br />
disease.<br />
Healthy Danish<br />
beech tree<br />
forest<br />
© Palle Madsen<br />
© Palle Madsen<br />
Palle Madsen: “You can say that<br />
ice ages have narrowed the gene<br />
pool we naturally have in Denmark.<br />
And the extent of genetic diversity<br />
is crucial to determining how<br />
well forests are able to adapt to<br />
an unknown future. The wider<br />
[the gene pool], the stronger. It<br />
is probably preferable to have<br />
an adaptable and healthy beech<br />
forest with genes from the Caspian<br />
forests in northern Iran, if the<br />
alternative is losing the Danish<br />
beech forest.”<br />
Denmark<br />
SCIENTIFIC BACKGROUND<br />
Yet, those “beeches green about her,” so celebrated in the Danish national anthem, along<br />
with other tree species across Denmark are especially vulnerable in a warming climate:<br />
Tree diseases are moving around the planet faster than ever before and possibly new,<br />
yet unknown pests and pathogens, including parasites like Phytophthora, pose a threat<br />
of unknown magnitude to Danish forest tree species. In recent times, elm and ash have<br />
been severely damaged by new diseases.<br />
Storms at present are a significant factor in damaging Danish forests. During the last<br />
40 years, three storms (in 1967, 1981, and 1999) damaged a total of 10 million m 3 . The<br />
Gudrun storm hit Denmark on 7-9 January 2005; the amount of felled forest equalled<br />
1.5 times the annual conifer harvest.<br />
OTHER IMPLICATIONS OF <strong>CLIMATE</strong> CHANGE<br />
Denmark consists of the Jutland peninsula and more than 400 islands. The whole of the<br />
country is lowland. The coastline<br />
CO 2<br />
e emissions<br />
in tons per<br />
capita in 2010<br />
WorldRiskIndex<br />
2012<br />
15<br />
14<br />
13<br />
12<br />
11<br />
10<br />
9<br />
8<br />
7<br />
6<br />
5<br />
4<br />
3<br />
2<br />
1<br />
0<br />
VERY<br />
LOW<br />
EU27<br />
10.0<br />
Denmark<br />
12.1<br />
World<br />
7.3<br />
LOW MEDIUM HIGH VERY<br />
HIGH<br />
has a length of more than<br />
7300 km. Over the last century, a<br />
linear trend of 0.44 mm rise per<br />
year (i.e. 4 cm per century) can<br />
be observed in Copenhagen water<br />
level data from the city Coastal<br />
Authority. The maximum observed<br />
rise is in southwestern Denmark,<br />
where the water level is rising by<br />
about 1 mm per year. 80% of the<br />
population lives in urban areas<br />
near the coast.<br />
Further information at www.overconsumption.eu
Czech<br />
Republic:<br />
severe<br />
floods<br />
Flash Flood in<br />
Jesenik nad<br />
Odrou in 2009<br />
Stepanka Hanzlikova<br />
© Ivan Stritesky<br />
© Aeordata s.r.o.<br />
Stepanka Hanzlikova (±70) who<br />
has lived in Jesenik nad Odrou for<br />
65 years saved her life by hanging<br />
for several hours on the birch tree<br />
that she planted a long time ago.<br />
“The water has always been here<br />
in smaller or greater quantities<br />
and has flooded pastures and<br />
fields around not affecting much<br />
the life of people. But the thing<br />
that happened in 2009 was a<br />
disaster for the entire village and I<br />
have a trauma that stays with me<br />
even after so many years.“<br />
Czech Republic<br />
Periodicity of<br />
maximum daily<br />
rainfalls during<br />
20.6.2009 – 6.7.2009,<br />
Czech Meteorological<br />
Institute<br />
Jesenik<br />
nad Odrou<br />
< 5<br />
5-10<br />
10-20<br />
20-50<br />
50-100<br />
>= 100<br />
SCIENTIFIC BACKGROUND<br />
The Czech Republic has experienced severe floods during the last two decades<br />
that has belied the experience of people in the last centuries. Extreme floods<br />
affected half of the country in the Morava River catchment in 1997, the city<br />
of Prague and Vltava and Elbe river basins in 2002 and 2013. During the last<br />
decades there have been several extreme rainfalls over small areas that caused<br />
local disasters. The village of Jesenik nad Odrou experienced the worst of such<br />
“flash floods” in 2009, five people died.<br />
FLASH FLOOD <strong>IN</strong> JESENIK NAD ODROU <strong>IN</strong> 2009<br />
In the summer of 2009 a series of extreme storms hit several regions in Northern<br />
Moravia. Eastern thermal low-pressure stayed over the country for 12 days, which<br />
was a very unusual situation that had not been historically observed and resulted in<br />
CO 2<br />
e emissions<br />
in tons per<br />
capita in 2010<br />
WorldRiskIndex<br />
2012<br />
15<br />
14<br />
13<br />
12<br />
11<br />
10<br />
9<br />
8<br />
7<br />
6<br />
5<br />
4<br />
3<br />
2<br />
1<br />
0<br />
VERY<br />
LOW<br />
EU27<br />
10.0<br />
Czech Republic<br />
14.0<br />
World<br />
7.3<br />
LOW MEDIUM HIGH VERY<br />
HIGH<br />
heavy and fast rainfalls affecting<br />
the same area over and over again<br />
– called a “train effect”. A total<br />
of 114 mm of water fell within<br />
3 hours in Jesenik nad Odrou and<br />
the water level in the local stream<br />
of Luha peaked from its regular<br />
800 l/sec to about 200 000 l/sec.<br />
Five people died in Jesenik<br />
nad Odrou, a total of<br />
23 family houses were<br />
destroyed, damages leveled at<br />
12 800 000 Euros.<br />
Further information at www.overconsumption.eu
Slovakia:<br />
Decrease<br />
in water<br />
capacity<br />
The moment of<br />
reaching the water<br />
after drilling deep<br />
into the ground<br />
Jozef Páleník,<br />
Hydrogeologist<br />
© Jozef Páleník<br />
© Jozef Páleník<br />
My name is Jozef Páleník. I have<br />
worked as hydrogeological expert<br />
since 1965. Part of my work is<br />
that I cooperate with companies,<br />
which drill wells for people. I must<br />
say that not so long ago it was<br />
much easier for people to reach<br />
water - it was enough to dig 10<br />
-15 metres underground and you<br />
had enough water all year round.<br />
Nowadays, it is neccessary to<br />
go much deeper, sometimes 70<br />
metres and more and drilling<br />
machines must be used. I suspect<br />
that this tendency will continue.<br />
The photography shows the<br />
drilling process in the moment of<br />
reaching the water, so that the<br />
owner can have his own well.<br />
SCIENTIFIC BACKGROUND<br />
Although Slovakia is well known for its large reserves of underground water, research<br />
on potential of underground water and springs has confirmed that in central, southern<br />
and south-eastern parts of Slovakia, the capacity of springs has dropped by 15 per cent<br />
in the period from 1981 to 2011 as compared to period until 1980. This is attributed to<br />
climate change impacts and not to human activities. Climate change impacts on water<br />
management in Slovakia relate to floods on the one hand and on the other hand to low<br />
or longlasting decrease in water capacity.<br />
OTHER IMPLICATIONS OF <strong>CLIMATE</strong> CHANGE<br />
• Increasing temperatures - implications on life cycles of plants, animals and people<br />
• Periods of heat waves over 30 °C - health complications (to elderly and people with<br />
breathing and cardiovascular problems)<br />
• Increasing number of tropical days (e.g. 22 tropical days in Bratislava in august 2003).<br />
• Droughts, torrential rains, floods and strong windstorms - damages on agriculture,<br />
infrastructure, and lives of people.<br />
Slovakia<br />
CO 2<br />
e emissions<br />
in tons per<br />
capita in 2010<br />
WorldRiskIndex<br />
2012<br />
15<br />
14<br />
13<br />
12<br />
11<br />
10<br />
9<br />
8<br />
7<br />
6<br />
5<br />
4<br />
3<br />
2<br />
1<br />
0<br />
VERY<br />
LOW<br />
EU27<br />
10.0<br />
Slovakia<br />
9.3 World<br />
7.3<br />
LOW MEDIUM HIGH VERY<br />
HIGH<br />
Further information at www.overconsumption.eu
Hungary:<br />
Life in<br />
a baking<br />
oven<br />
Szép Gyöngyvér<br />
Appartment<br />
blocks in<br />
Budapest,<br />
Óbuda<br />
© Domaniczky Tivadar<br />
© Domaniczky Tivadar<br />
Szép Gyöngyvér, 46 years old,<br />
unemployed, mother of 3 boys<br />
and a girl. The 5 member family<br />
live in 50 sqm prefabricated flat.<br />
„We have to live on a 500 Euros<br />
monthly income. The utilities<br />
cost up to 260 Euros. The district<br />
heating cost 130 Euros in winter<br />
and 60 Euros in summer, while<br />
the temperature in the flat is not<br />
comfortable, too hot all the time.<br />
In winter it’s 26 C° and I cannot<br />
regulate it so I have to leave the<br />
window open to reach a normal<br />
temperature, so basically I warm<br />
the street. In summer, I measured<br />
33 C° in the flat which means I<br />
cannot sleep and I suffer from<br />
oedema and swelling. I remember<br />
when I moved here 7 years ago<br />
the temperature was at least 4<br />
C° less.“<br />
SCIENTIFIC BACKGROUND<br />
There are nearly 788 000 prefabricated flats in the country. 2,1 million people live<br />
there. Technological problems, the roofing and the plumbing, the inadequate heat and<br />
noise insulation, the unregulatable district heating makes the living costs in these<br />
microdistricts disproportionately high. The national program for insulating these flats is<br />
proceeding very slowly.<br />
In the 2003 heatwave, the number of heat-days, when the maximum temperature<br />
exceeds 30°C, was 45 in national average, and this was breaking earlier records. During<br />
the heatwaves in the period 2008–2011, a 15-28 percent increase in the mortality rate<br />
was observed. 80 percent of the cases involved a person above 65. The urban population<br />
is endangered to a greater extent because the temperature is several degrees higher,<br />
the natural ventilation is weaker and the radiation of the buildings sustains the high<br />
temperature several hours longer.<br />
Budapest<br />
Hungary<br />
CO 2<br />
e emissions<br />
in tons per<br />
capita in 2010<br />
WorldRiskIndex<br />
2012<br />
15<br />
14<br />
13<br />
12<br />
11<br />
10<br />
9<br />
8<br />
7<br />
6<br />
5<br />
4<br />
3<br />
2<br />
1<br />
0<br />
VERY<br />
LOW<br />
EU27<br />
10.0<br />
Hungary<br />
6.7<br />
World<br />
7.3<br />
LOW MEDIUM HIGH VERY<br />
HIGH<br />
Further information at www.overconsumption.eu
Ecuador:<br />
Melting<br />
tropical<br />
glaciers<br />
The Chimborazo<br />
volcano, 6268 m.<br />
Sr. Olmedo Cayambe,<br />
president of CORDTUCH, the<br />
community tourism organization of<br />
the Chimborazo region<br />
© Silvia Vallejo, EcoCiencia<br />
© Felipe Segovia / EcoCiencia<br />
“Well, up there the Yanacocha and<br />
the Chaquishkacocha lagoons used<br />
to be the watering place for the<br />
cattle of Tambohuasha community.<br />
Now, they have disappeared because<br />
it is less raining and becoming much<br />
warmer. To have water for their<br />
cattle, the community must bring it<br />
through pipes from the neighbouring<br />
Carihuayrazo mountain. During the<br />
last decade, the cattle has been<br />
grazing every time higher up in the<br />
Chimborazo Fauna Reserve in order<br />
to have more access to water and to<br />
pastures depending on it.<br />
The last “hielero” of the Chimborazo<br />
In the past, ice used to be extracted<br />
upstream the lagoons from the<br />
Chimborazo by indigenous inhabitants<br />
for being sold to urban dwellers.<br />
Presently there is only one “hielero”<br />
left, Don Baltasar Ushca. He told me<br />
that before the Chimborazo was quite<br />
cold, there was enough rain, and the<br />
snow used to remain even where the<br />
communities are settled, being even<br />
40 cm high at 4,000 m above sea<br />
level. Now however, the ice starts<br />
at 5.500 m, and there is no snow<br />
anymore.”<br />
SCIENTIFIC BACKGROUND<br />
The smallest glaciers in the Andes, such as those in Carihuayrazo, located<br />
below 5100 m height are irremediably in unbalance with current climate:<br />
From 1939 to 2006, temperature in the tropical Andes increased by 0,7°<br />
C. It is the level of frost and the relation between rain and snowfall that<br />
determine how much a glacier is melting at its surface. Actually, the<br />
glaciers are losing mass, and if the current conditions prevail, residual<br />
glaciers will disappear in a few years or in up to two decades.<br />
Ecuador<br />
Chimborazo<br />
CO 2<br />
e emissions<br />
in tons per capita<br />
2010<br />
WorldRiskIndex<br />
2012<br />
15<br />
14<br />
13<br />
12<br />
11<br />
10<br />
9<br />
8<br />
7<br />
6<br />
5<br />
4<br />
3<br />
2<br />
1<br />
0<br />
VERY<br />
LOW<br />
EU27<br />
10.0<br />
Ecuador<br />
3.9<br />
World<br />
7.3<br />
LOW MEDIUM HIGH VERY<br />
HIGH<br />
Further information at www.overconsumption.eu
The Andean<br />
Amazonia:<br />
extreme<br />
climate<br />
variability<br />
Maria Ushca<br />
from Santa Rosa Sector, Santa<br />
Clara Canton, in Pastaza Province,<br />
Ecuador<br />
Upper Rio Pastaza<br />
near Mera<br />
© Verónica Angulo, EcoCiencia<br />
© Veronica Angulo / EcoCiencia<br />
“Local people have experienced<br />
river floods in recent years that are<br />
not normal for the winter months,<br />
and have suffered some material<br />
loss. Although, part of the bridge<br />
from Santa Clara parish to Tena<br />
was damaged four months ago<br />
(start of 2013), the problem was<br />
solved almost immediately, as the<br />
authorities are working to fix the<br />
town sewers which are very small.”<br />
Ecuador<br />
Colombia<br />
Peru<br />
Venezuela<br />
Guyana<br />
Suriname French Guyana<br />
Bolivia<br />
Brazil<br />
SCIENTIFIC BACKGROUND<br />
The Upper Amazon is located on the eastern<br />
slope of the Andes between 600 - 1300 meters<br />
above sea level and its high rainfall is normal<br />
(3000-4500 mm/year). The temperature ranges<br />
between 14 and 24°C, with permanent cloud<br />
cover. The volcanic Andean rivers that flow<br />
into the Amazon River watershed - such as the<br />
Pastaza and the Coca – carry sediment that<br />
feeds the lowland every season.<br />
In the piedmont, there are increasingly<br />
evident alterations in the dry and rainy<br />
seasons, resulting in extreme weather events,<br />
a decrease in rainfall and an increase in<br />
temperature. In 2005, the lowland Amazon had<br />
its worst droughts and, in 2010, it suffered<br />
again the effects of heat and lack of rain,<br />
which start in the high jungle.<br />
The abnormal climate variability caused<br />
prolonged periods of drought followed by<br />
heavy rains that caused landslides, floods<br />
and disruption to infrastructure and crops<br />
that threaten human security and the Amazon<br />
forests.<br />
<br />
San Rafael Falls /<br />
upper Rio Coca<br />
(piedmont):<br />
dry season<br />
flow in february<br />
...<br />
… and rainy<br />
season flow in june<br />
<br />
© Segundo Chasipanta ✝<br />
© Segundo Chasipanta ✝<br />
-3 -2 Chile -1 0 Paraguay 1 2 3<br />
The extent of the 2005 megadrought in<br />
the western Amazon rainforests during the<br />
summer months of June, July and August<br />
as measured by NASA satellites. The most<br />
impacted areas are shown in shades of<br />
red and yellow. Image credit: NASA/JPL-<br />
Caltech/GSFC<br />
Further information at www.overconsumption.eu
Brazil 1 /<br />
Rio Negro:<br />
Unexpected<br />
rainfalls<br />
Tributary to<br />
Isana River<br />
André Baniwa<br />
© Emil Benesch<br />
© Emil Benesch, KB Österreich<br />
My name is André Baniwa. As my<br />
name is already indicating I am<br />
part of the indigenous people<br />
called baniwa. My mother tongue<br />
is baniwa. I am about 40 summers<br />
old, as we are accustomed to say<br />
– thus underlining the importance<br />
of the summer-period in our<br />
culture and for our lives. I was<br />
born in Tucumã Rupitá, a village<br />
of 200 inhabitants at Isana River,<br />
a tributary river of the Rio Negro<br />
in NW Brazil. Looking for it at the<br />
map it helps to look out for the<br />
„head of the dog“, as the Region at<br />
the upper Rio Negro is also called.<br />
Being active in the indigenous<br />
movement for 20 years, I am<br />
concerned about changes I have<br />
witnessed throughout the recent<br />
years. It was in February 2012,<br />
when a week long period of rain<br />
instead of the traditional sunny<br />
and dry weather lead to a period<br />
of hunger for the people in my<br />
region. Due to the unexpected<br />
rainfalls in our summer, the roots<br />
of the manioc plants started to<br />
rot in the soil.<br />
SCIENTIFIC BACKGROUND<br />
The Isana Region has an annual precipitation of 3460 mm.<br />
Severe changes in precipitation in the Rio Negro Region in recent years are<br />
reflected in the flow of the river. In the year 2009, Rio Negro showed the<br />
highest water levels registered in history. Within one year occured one of<br />
the most severe droughts and the river had one of the lowest water levels<br />
in history. Another big drought hit the region in 2005, when whole tributary<br />
rivers dried out, isolating villages that usually are reached by boat.<br />
Rio Negro Region<br />
Brazil<br />
CO 2<br />
e emissions<br />
in tons per<br />
capita in 2010<br />
There are no emissions data<br />
available for Rio Negro or<br />
indigenous peoples in Brazil.<br />
Due to their lifestyle, they<br />
are very likely far below<br />
1 t per capita (as most of<br />
Brazil’s emissions result from<br />
deforestation).<br />
WorldRiskIndex<br />
2012<br />
15<br />
14<br />
13<br />
12<br />
11<br />
10<br />
9<br />
8<br />
7<br />
6<br />
5<br />
4<br />
3<br />
2<br />
1<br />
0<br />
VERY<br />
LOW<br />
EU27<br />
10.0<br />
Brazil<br />
8.3<br />
World<br />
7.3<br />
LOW MEDIUM HIGH VERY<br />
HIGH<br />
Further information at www.overconsumption.eu
Brazil 2 /<br />
Rio Negro:<br />
An unusual<br />
cooperation<br />
to confront<br />
global<br />
challenges<br />
Almerinda Ramos de Lima<br />
On the right, Hans Kandler / CA Austria<br />
Drying rack on<br />
the board of<br />
Isana River for<br />
beju, a kind of<br />
manioc bread.<br />
© Klimabündnis Österreich, Photo: Emil Benesch<br />
© Emil Benesch, KB Österreich<br />
Almerinda Ramos de Lima, member<br />
of the indigenous people called<br />
Tariano, is the first woman at the<br />
head of the organization FOIRN:<br />
“Living in the region for 3000 years,<br />
our peoples have developed<br />
a calender, that foresees the<br />
preparation of fields in our summer<br />
months. Traditionally every summer<br />
each family creates space for a<br />
new field. The men cut the trees<br />
and then burn them. The ashes thus<br />
created serve as fertilizer for the<br />
new field plantation. The rainfalls<br />
in February 2012 made the burning<br />
of the cut trees impossible. No new<br />
fields could be prepared during<br />
the summer-period. After summer<br />
the rainy season starts, so also<br />
no chance to create new fields.<br />
Bearing in mind that we can use<br />
our fields only for 2 years for the<br />
plantation of manioc, ananas and<br />
pepper before the vegetation of the<br />
rainforest comes back and takes<br />
over again, the cultivation area of<br />
each family was reduced to the half<br />
by the wet summer of 2012.”<br />
SCIENTIFIC BACKGROUND<br />
The monthly average precipitation in<br />
Sao Gabriel da Cachoeira, situated<br />
at the Rio Negro shows less<br />
precipitation in summer periods,<br />
when traditionally the new fields<br />
are prepared. The figures for 2012<br />
show significant deviations from the<br />
average mesurements of 30 years.<br />
The average monthly rainfall - based on measurements<br />
in the period from 1961-1990 - compared to the monthly<br />
rainfall in 2012.<br />
(rainfall in mm)<br />
500<br />
400<br />
300<br />
200<br />
100<br />
0<br />
2012<br />
Period 1961-1990<br />
JAN FEB MAR APR MAY JUN JUL AUG SEP OCT NOV DEC<br />
Source: <strong>IN</strong>MET, http://www.inmet.gov.br/portal/index.php?r=clima/normaisClimatologicas<br />
BACKGROUND OF <strong>CLIMATE</strong> <strong>ALL</strong>IANCE AUSTRIA’S RELATION<br />
WITH THE RIO NEGRO REGION<br />
The federation of the indigenous organisations of the Rio Negro Region, FOIRN<br />
has as main objective to defend the rights of the 23 indigenous peoples in the<br />
region. Principal successes are the creation<br />
of indigenous territories of the size of<br />
122 000 km 2 . In the indigenous territories<br />
sustainable, indigenous lifestyles can be<br />
maintained and due to this 99.94% of the<br />
rainforests are intact.<br />
in 1998, FOIRN received land rights for 110,000 km 2 .<br />
The blue area of 8000 km 2 has been declared an indigenous<br />
territory in April 2013<br />
FOIRN and Climate Alliance Austria have<br />
supported one another in a partnership<br />
since 1993.<br />
Further information at www.overconsumption.eu
Peruvian<br />
Amazon:<br />
Loreto<br />
region<br />
Aurelio Chino Dahua,<br />
President of the indigenous<br />
organisation FEDIQUEP<br />
Flood in Bolivar<br />
/ Loreto<br />
© FORMABIAP<br />
© Astrid Sieler<br />
Aurelio Chino Dahua, 40 years<br />
old, Quechua, President of<br />
the indigenous organization<br />
FEDIQUEP: “In the Loreto<br />
region, we have experienced<br />
serious (environmental)<br />
changes. Heavy floods that<br />
destroy our fields and houses<br />
are increasingly common. We<br />
observe changes in nature<br />
that affect our daily lives<br />
and our way of life. There are<br />
fewer fruits and hunters often<br />
come home without a kill. We<br />
have the impression that the<br />
forest itself is also dry, which<br />
therefore leads to more forest<br />
fires. I am very concerned<br />
about the situation and what<br />
impact this has on our children<br />
and our future. “<br />
SCIENTIFIC BACKGROUND<br />
Peru is particularly affected by climate change. The consequences are<br />
floods, landslides, but also waves of drought and cold. Rainfall distribution<br />
has been significantly altered by climate change in all ecosystems. While<br />
in some regions (Loreto, Apurimac, Cusco) precipitation has increased, the<br />
trend is a decline in the south.<br />
The Andean glaciers have lost 22 percent of their mass in the last 35 years.<br />
The melting of the glaciers, which are particularly important for the storage<br />
of fresh water, has lead to a decline in the quantities of water flowing from<br />
the mountains to the coastal desert.<br />
Peru<br />
Loreto<br />
CO 2<br />
e emissions<br />
in tons per capita<br />
2010<br />
There are no emissions<br />
data available for the<br />
Loreto region or indigenous<br />
peoples in Peru. Due to their<br />
lifestyle, they are very likely<br />
far below 1 t per capita.<br />
WorldRiskIndex<br />
2012<br />
15<br />
14<br />
13<br />
12<br />
11<br />
10<br />
9<br />
8<br />
7<br />
6<br />
5<br />
4<br />
3<br />
2<br />
1<br />
0<br />
VERY<br />
LOW<br />
EU27<br />
10.0<br />
Peru<br />
2.6<br />
World<br />
7.3<br />
LOW MEDIUM HIGH VERY<br />
HIGH<br />
Further informations at: www.overconsumption.eu
Amazon:<br />
Droughts<br />
The Amazon is home to<br />
the largest rainforest<br />
in the world, covering<br />
roughly 6 million<br />
square kilometres.<br />
Around a third of<br />
all animal and plant<br />
species on Earth<br />
live here, as well<br />
as over 1.5 million<br />
indigenous people<br />
from approximately<br />
400 different nations.<br />
© Gustavo Tosello / ISA<br />
The dry port of São<br />
Gabriel da Cachoeira<br />
on the Rio Negro,<br />
February 2007<br />
View from the Alto<br />
da Serra de Tunuí.<br />
Waterfalls on the<br />
Isana River in northern<br />
Brazil<br />
Diego Escobar<br />
COICA<br />
© Nicole Romijn Fotografie<br />
© Camila Sobral Barra / ISA<br />
Diego Escobar, Coordinator of<br />
Territories, Environment and Natural<br />
Resources at COICA (Coordinator<br />
of Indigenous Organizations of the<br />
Amazon Basin) and Vice-Chair of<br />
the Climate Alliance:<br />
In addition to exceptional rainfall<br />
in some regions there were more<br />
“droughts of the century” in the<br />
Amazon, such as in 2005 and 2010.<br />
All the rivers dried up completely,<br />
so that the people living in those<br />
regions could not leave their<br />
communities and had to be supplied<br />
by the military. Millions of trees<br />
died off; forest fires increased.<br />
In addition to the exploitation of<br />
natural resources, such as illegal<br />
logging, the expansion of agriculture<br />
and large-scale infrastructure<br />
projects, climate change is a new<br />
additional danger for us: We, the<br />
indigenous peoples of the Amazon,<br />
protect the rain forest, which has<br />
always been the foundation of our<br />
lives.<br />
SCIENTIFIC BACKGROUND<br />
Observations in the Amazon by satellite and on the ground have shown<br />
more dying trees and forest fires during the recent drought. About 70 million<br />
hectares of forest in the western Amazon suffered during the dry season in<br />
2005 from severe water shortage and a concomitant reduction of the canopy<br />
and loss of moisture that lasted until the next drought period in 2010.The<br />
result suggests that a 5 - 10 year cycle of drought leads to a permanent<br />
change in the forest roof.<br />
Current rates of deforestation and forest degradation mean the Amazon is<br />
approaching a tipping point, in which rain forests become seasonal forests or<br />
even savannahs and convert from carbon sinks into carbon sources.<br />
Ecuador<br />
Colombia<br />
Peru<br />
Chile<br />
Venezuela<br />
Guyana<br />
Suriname French Guyana<br />
AMAZON<br />
Bolivia<br />
Paraguay<br />
Brazil<br />
© Copyright: Klima-Bündnis<br />
Rainforest biomass is a huge<br />
carbon sink: an average<br />
hectare of rainforest<br />
binds approximately 5 –<br />
20 tonnes of carbon<br />
dioxide annually and stores<br />
around 250 tonnes of<br />
carbon permanently in the<br />
biomass. Where indigenous<br />
people have secured their<br />
land rights, the rain forest<br />
is the best preserved.<br />
Consequently, they make an<br />
outstanding contribution to<br />
environmental protection.<br />
Further information at: www.overconsumption.eu<br />
Argentina
Burkina<br />
Faso 1:<br />
crops<br />
damaged<br />
by floods<br />
Yempabou Lankoande<br />
Floods in<br />
Burkina Faso,<br />
Sept. 2007<br />
© Ba Mahamadou<br />
© Severine Flores / Tearfund.<br />
My name is Yempabou LANKOANDE,<br />
I am a farmer from Manni. I farm in<br />
the Manni rice plain. The rain has<br />
caused a lot of damage here. All the<br />
young plants were washed away<br />
by the force of the water. Even the<br />
topsoil is gone with all the seedlings<br />
we had planted. We need to start<br />
from scratch. I had planted corn on<br />
my plot cash to get me through the<br />
lean period and the corn has just<br />
been totally engulfed by water. There<br />
is no hope, neither for the corn nor<br />
rice crops. This harvest has been<br />
totally lost.<br />
SCIENTIFIC BACKGROUND<br />
IPCC experts agree that floods alternating with droughts will become a common<br />
phenomenon in the Sahel and sub-Sahel. For Burkina Faso, this has become<br />
their reality. Since 2007, the country has experienced repeated flooding.<br />
• 2009: 273 mm rain falls on the city of Ouagadougou, about 150,000 victims in<br />
the city and thousands of people in the countryside.<br />
• 2010: flooding in five of the country’s 13 regions, with more than 26,000<br />
victims.<br />
• 2011-2012 crop year: late onset of the rains, poor distribution in time and their<br />
sudden and early cessation led to a 16% drop in agricultural production and<br />
146 municipalities experiencing food insecurity.<br />
Annual precipitation in mm<br />
Number of rainy days 1098,5<br />
933<br />
815<br />
733<br />
2006<br />
54 45 52 49<br />
Source: ARFA, Fada N’Gourma office<br />
2007 2008 2009<br />
Burkina Faso<br />
Fada<br />
N’Gourma<br />
CO 2<br />
e emissions<br />
in tons per<br />
capita in 2010<br />
WorldRiskIndex<br />
2012<br />
15<br />
14<br />
13<br />
12<br />
11<br />
10<br />
9<br />
8<br />
7<br />
6<br />
5<br />
4<br />
3<br />
2<br />
1<br />
0<br />
VERY<br />
LOW<br />
EU27<br />
10.0<br />
Burkina Faso<br />
1.4<br />
World<br />
7.3<br />
LOW MEDIUM HIGH VERY<br />
HIGH<br />
Further information at www.overconsumption.eu
Burkina<br />
Faso 2:<br />
Tornadoes<br />
and<br />
instability<br />
Ousséni Sayaogo<br />
House<br />
destroyed by a<br />
tornado<br />
© Ba Mahamadou<br />
© Ba Mahamadou<br />
My name is Ousséni SAYAOGO, I am<br />
a farmer from Niessega.<br />
On Monday, May 13, 2013, I was at<br />
Gourcy when I was called and told<br />
that my house had been destroyed<br />
by strong winds followed by rain.<br />
When I arrived, I saw the damage.<br />
The house was demolished, the roof<br />
sheeting scattered by the wind.<br />
I had just built this house for my<br />
family. Fortunately, there was no<br />
loss of life.<br />
At the moment, I have no more<br />
money left to rebuild the house.<br />
Therefore I will have to wait until<br />
next year hoping to be able to<br />
rebuild. In the meantime, I ask<br />
myself where will my family and I<br />
stay.<br />
This is the first time I have<br />
witnessed something like that.<br />
It is abnormal for our village as<br />
it happened in May and the rainy<br />
season, even when it comes early,<br />
starts in mid-June.<br />
SCIENTIFIC BACKGROUND<br />
According to the 2007 IPCC report, in the short-term, the impact of climate<br />
change will be the product of increased frequency and intensity of extreme<br />
events such as droughts, floods, heat waves. For Burkina Faso this means<br />
unstable rainfall patterns and rising temperatures.<br />
Rainfall instability means shorter rainy seasons and the concentration of<br />
rainwater over a short period. An important feature of rainfall instability is<br />
increased occurrence of rainy, stormy events accompanied by tornadoes at<br />
unusual times of the year.<br />
Evolution of interannual rainfall in Fada N'Gourma<br />
Rainfall (mm)<br />
1200<br />
1100<br />
1000<br />
900<br />
800<br />
700<br />
600<br />
500<br />
y = 1.7939x + 770.88<br />
R² = 0.0297<br />
400<br />
1971<br />
1973<br />
1975<br />
1977<br />
1979<br />
1981<br />
1983<br />
1985<br />
1987<br />
1989<br />
1991<br />
1993<br />
1995<br />
1997<br />
1999<br />
2001<br />
2003<br />
2005<br />
2007<br />
2009<br />
2011<br />
Rainfall Average Trend<br />
Further information at www.overconsumption.eu
Burkina<br />
Faso3:<br />
Droughts<br />
Mahamadi Sawadogo<br />
Agricultural<br />
land<br />
degradation<br />
/ Zondoma<br />
Province<br />
© Ba Mahamadou<br />
© Ba Mahamadou<br />
I’m SAWADOGO Mahamadi, I come<br />
from the Plateau-Central region of<br />
Burkina Faso.<br />
In my village, I was a farmer leader<br />
for local projects: recovery of<br />
degraded soil, reforestation and so<br />
on.<br />
With climate change, things<br />
changed: drought, loss of vegetation<br />
cover, soil depletion. So I was forced<br />
to emigrate in search of better<br />
living conditions and I came to<br />
Bourguéogo in 2003. Here, while<br />
agro-climatic conditions are better,<br />
other problems arise, such as a lack<br />
of drinking water and roads, and as<br />
residents of the wildlife reserve,<br />
our land is exposed to damage by<br />
elephants. Without an agricultural<br />
plan, poor production practices<br />
will accelerate the degradation of<br />
natural resources. Will we also have<br />
to migrate from here?<br />
SCIENTIFIC BACKGROUND<br />
Throughout the North and Centre of the country, the sharp deterioration of the<br />
ecosystem has led to soil exhaustion and insufficient rainfall. This is at the root<br />
of food insecurity, which accentuates the phenomenon of poverty.<br />
The immediate consequences of the disappearance of plant resources are the<br />
worsening effects of winds, including the Harmattan, increases in temperature,<br />
rainfall disturbance and decreased rainfall.<br />
Frequent droughts have led to the migration of some of the population of<br />
the Plateau-Central to the west and the east. These migrants contribute<br />
significantly to the degradation of reception areas and will face many<br />
challenges.<br />
ACTION<br />
The Association for Agroecological<br />
Research and<br />
Training (ARFA) helps<br />
farmers increase their yields<br />
by ecological cultivation<br />
methods and better adapt<br />
to climate change.<br />
Migration of lines with equal quantity of precipitation<br />
600 mm and 900 mm<br />
900<br />
900<br />
900<br />
900<br />
900<br />
BOBO-DIOULASSO<br />
600<br />
600<br />
600<br />
600<br />
OUAHIGOUYA<br />
DEDOUGO<br />
GAOUA<br />
BOROMO<br />
600<br />
OUAGADOUGOU<br />
PO<br />
1931-1960<br />
1951-1980<br />
1961-1990<br />
1971-2000<br />
1981-2010<br />
DORI<br />
BOGANDE<br />
600<br />
600<br />
FADA NGOURMA<br />
600<br />
600<br />
600<br />
900<br />
900<br />
Source: Direction de la métérologie<br />
900<br />
900<br />
900<br />
Further information at www.overconsumption.eu
Niger 1:<br />
Pastoral<br />
Crisis<br />
Jobari Mokao,<br />
a stricken nomadic herder<br />
Animals lack pasture<br />
and have lost weight<br />
and market value<br />
© CESAO -PRN<br />
© CESAO -PRN<br />
I’m Jobari Mokao from Bermo<br />
village, which is north of Dakoro<br />
in pastoral areas of the Maradi<br />
region of Niger. For over ten years,<br />
successive years of drought have<br />
led to a shortage of fodder, a<br />
deterioration in the quality of our<br />
pastures and insufficient water for<br />
our animals, which have caused<br />
repeated pastoral crises.<br />
During these years of crisis, 30%<br />
to 100% of livestock is lost. If they<br />
survive, the strongest animals<br />
lose over 1/3 of their total weight<br />
and more than 90% of their value.<br />
Thus, at the height of the crisis in<br />
2010, an animal worth 250,000 CFA<br />
francs was sold for no more than<br />
10,000 CFA francs in our region.<br />
Worse, after suffering through the<br />
dry season, it is often the thermal<br />
shock of the first rains that finally<br />
overwhelms the animals.<br />
SCIENTIFIC BACKGROUND<br />
Niger has suffered repeated food crises for a decade. These crises are the result of<br />
disruptions in rainfall: lack of rainfall, poor distribution of rainfall in space and time,<br />
short winters, floods and so on.<br />
The 2011-2012 food crisis was characterised by a situation of food insecurity<br />
for 5.5 million people, or more than a third of the population. The forage deficit<br />
was estimated at 50% of livestock consumption needs. In 2010, a pastoral crisis<br />
had resulted in the loss of nearly 5 million cattle or a quarter of the stock. The<br />
poorest households lost nearly 90% of their animals, and hence their means of<br />
survival. These recurring pastoral crises have dire consequences on the lives of<br />
communities in pastoral areas such as in north Dakoro in the Maradi region of Niger.<br />
Niger<br />
Agadez<br />
Tahoua<br />
Zinder<br />
Tillaberi<br />
DAKORO Maradi<br />
Dosso<br />
Diffa<br />
CO 2<br />
e emissions<br />
in tons per capita<br />
2010<br />
15<br />
14<br />
13<br />
12<br />
11<br />
10<br />
9<br />
8<br />
7<br />
6<br />
5<br />
4<br />
3<br />
2<br />
1<br />
0<br />
WorldRiskIndex<br />
2012 VERY<br />
LOW<br />
EU27<br />
10.0<br />
Niger<br />
0.6<br />
World<br />
7.3<br />
LOW MEDIUM HIGH VERY<br />
HIGH<br />
Further information at www.overconsumption.eu
Niger 2:<br />
Degradation<br />
of the<br />
ecosystem<br />
Finda LOMPO,<br />
67 years old, from Niaktiré village<br />
Loss of vegetation<br />
cover in Tillabéri<br />
Region<br />
© CESAO -PRN<br />
© CESAO -PRN<br />
I’m Finda LOMPO, I was born<br />
around 1946 in Niaktiré, in<br />
Makalondi commune, in the<br />
Tillabéri Region of Niger:<br />
The forest has lost its soul. It<br />
used to be full of gum arabic and<br />
wild fruits of inestimable value to<br />
local people.<br />
Today, everything is gone. Worse,<br />
medicinal plants we use have<br />
disappeared.<br />
For women, it has brought despair<br />
because with them they have lost<br />
their livelihood.<br />
The forest is disappearing and we<br />
call for it to be saved.<br />
Tillaberi<br />
Niger<br />
Tahoua<br />
Dosso<br />
MAKALONDI<br />
Maradi<br />
Agadez<br />
Zinder<br />
Diffa<br />
SCIENTIFIC BACKGROUND<br />
Floods, torrential rains, rivers breaking their banks and lower rainfall, which<br />
are the result of climate change, cause losses of woody and herbaceous plant<br />
species thereby deteriorating the quality of the ecosystem.<br />
In Niger, about 100,000 to 120,000 hectares of forest land are lost every year,<br />
forcing 25% of the population and their livestock to live on degraded land with a<br />
deterioration in their living conditions, as is the case in Makalondi commune, in<br />
the Tillabéri Region.<br />
The rainfall index determines how wet or dry the rainy season was for the<br />
period 1951 to 2007, in the Tillabéri Region:<br />
Rainfall Index<br />
2.5<br />
2.0<br />
1.5<br />
1.0<br />
0.5<br />
0.0<br />
-0.5<br />
-1.0<br />
-1.5<br />
-2.0<br />
1951<br />
1954<br />
1959<br />
1963<br />
1967<br />
1971<br />
1975<br />
Positive values indicate years in which rainfall exceeded the average for the period 1951 - 2007, and<br />
negative values indicate years in which it was lower. The chart shows that in 1969, Tillabéri Region,<br />
like the rest of the Sahel, shifted from a period of seasonal excess to one of recurring seasonal<br />
deficit with disastrous consequences for the ecosystem.<br />
1979<br />
1983<br />
1987<br />
1991<br />
1995<br />
1999<br />
2003<br />
2007<br />
Further information at www.overconsumption.eu
India1:<br />
More<br />
intensive<br />
rainsand<br />
floods<br />
Kedarnath flood<br />
Ram Singh and his wife<br />
© Soma Basu/ Down to Earth<br />
© Rohit Dimri<br />
At 7.18 pm on June 16 2013, Ram<br />
Singh heard the loudest crack<br />
in 45 years of his life. It was the<br />
deafening roar of a disaster. “I felt<br />
as if the sky had been torn asunder.<br />
Within seconds, a massive wall of<br />
water gushed towards Kedarnath<br />
Temple. Huge boulders flung into<br />
the sky like an explosion. In less<br />
than 15 minutes, thousands of<br />
people were swept away.” Singh<br />
was on pilgrimage with 17 people<br />
from his hometown Ujjain in Madhya<br />
Pradesh. He is returning home with<br />
only five. “After having been in the<br />
temple, my son wanted to see the<br />
hills, so I took him along. My wife<br />
followed us,” he says. “That is how<br />
we survived. I have no clue where<br />
the rest of my family are.”<br />
SCIENTIFIC BACKGROUND<br />
The Uttarakhand floods in June 2013:<br />
Surya Prakash, associate professor<br />
at the National Institute of Disaster<br />
Management (NIDM), says that the<br />
abnormally high amount of rain was<br />
caused by the fusion of Westerlies<br />
with the monsoonal cloud system.<br />
Additionally, a huge quantity of water<br />
was probably released from the<br />
melting of ice and glaciers due to high<br />
temperatures during May and June,<br />
which led to the breaching of morainedammed<br />
lakes. Several hundred<br />
people were killed; thousands went<br />
missing.<br />
Kedarnath<br />
India<br />
OTHER IMPLICATIONS OF<br />
<strong>CLIMATE</strong> CHANGE<br />
Changing monsoon patterns in India: A trend analysis<br />
by S. K. Dash, Professor and Head of the Centre for<br />
Atmospheric Sciences, Indian Institute of Technology<br />
Delhi, shows that between 1951 and 2000, India<br />
witnessed short spells of heavy-intensity rainfall -<br />
lasting less than four days - during monsoons and<br />
fewer long spells with moderate rainfalls.<br />
Having collected rainfall data from 2,599 stations<br />
between 1901 and 2005, India Meteorological<br />
Department (IMD) scientists warn of increased flood<br />
risk over most parts of India. “Increasing flood risk is<br />
now recognised as the most important sectoral threat<br />
from climate change.” (Current Science, June 2013).<br />
CO 2<br />
e emissions<br />
in tons per<br />
capita in 2010<br />
15<br />
14<br />
13<br />
12<br />
11<br />
10<br />
9<br />
8<br />
7<br />
6<br />
5<br />
4<br />
3<br />
2<br />
1<br />
0<br />
WorldRiskIndex<br />
2012 VERY<br />
LOW<br />
EU27<br />
10.0<br />
India<br />
2.2<br />
World<br />
7.3<br />
LOW MEDIUM HIGH VERY<br />
HIGH<br />
Further information at www.overconsumption.eu
India2:<br />
Ladakh –<br />
Flash<br />
floods<br />
Ladakh’s<br />
topography<br />
House in Leh,<br />
destroyed by<br />
fl o o d<br />
© Ladakh Art and Media Organisation(LAMO)<br />
© Papia Samajdar/CSE<br />
CASE STUDY<br />
August 2010. A massive flood<br />
ravaged all of Leh, killing<br />
257 people in the district, injuring<br />
thousands, and destroying<br />
property, infrastructure and<br />
livelihoods. The flood was the<br />
result of very heavy rain falling<br />
over a small area. There were<br />
other factors: bright sunshine in<br />
June and July melted the snow<br />
faster than usual, leading to<br />
more humidity. The temperature<br />
remained low, leading to the<br />
formation of dense clouds at<br />
a low height. As these clouds<br />
moved over glaciers, they<br />
condensed further, resulting in<br />
a cloudburst. Cloud bursts and<br />
thunder showers, unprecedented<br />
in the history of Ladakh, caused<br />
flashfloods in almost all the<br />
valleys along the Indus river of<br />
the Leh district.<br />
REGIONAL CONTEXT AND BACKGROUND<br />
Ladakh is located at the northwestern side of the Himalayas, flanked by four mountains<br />
ranges namely Himalayan, Zanskar, Ladakh and Karakoram with extremely elevated snow<br />
capped peaks. These mountain chains and the Tibetan plateau are home for 45 000<br />
individual glaciers, covering an area of 90,000 sq km. They are the biggest storehouse for<br />
fresh water outside the polar caps, sometimes called “the water tower of Asia” or the<br />
“third pole”, and feed the major rivers of Asia. But the Himalayan glaciers, the source of<br />
water for billions, are retreating faster than glaciers in any other part of the world<br />
(Cruz et al., 2007). Credit: NASA EROS Data Center, September 9, 2001.<br />
EVIDENCE OF <strong>CLIMATE</strong> CHANGE <strong>IN</strong> LADAKH<br />
Ladakh is a cold desert, with precipitation limited to as little as 2 days a year. In the<br />
past 20 to 25 years there has been a trend towards greater precipitation, but in a highly<br />
irregular pattern. For example, in 2002, there was almost no rainfall, but a large amount<br />
of snow. By contrast, the total precipitation recorded in 2006 was 150mm rain against<br />
an average over 1995 to 2007 of 32mm rain (Field Research Laboratory in Leh).<br />
Himalaya<br />
Karakorum<br />
I<br />
Leh<br />
N D U<br />
S<br />
160<br />
140<br />
120<br />
100<br />
80<br />
60<br />
40<br />
20<br />
Rain<br />
Snow<br />
0<br />
1995 1996 1997 2002 2003 2004 2005 2006 2007<br />
Source: Field Research Laboratory (FRL) in Leh<br />
Further information at www.overconsumption.eu
India 3:<br />
Ladakh –<br />
Water<br />
reporters<br />
Ringchen<br />
water reporter from Domkar<br />
Flood in Leh<br />
district: The<br />
area Tashi<br />
Gatsal in<br />
Choglamsar<br />
was worst hit<br />
by flashflood in<br />
2010 on August<br />
6, and in Tashi<br />
Gatsal alone<br />
about 200<br />
people died.<br />
© CSEIndia<br />
© Ladakh Art and Media Organisation (LAMO).<br />
Ringchen, water reporter from<br />
Domkar village, about 120 kms from<br />
Leh: “In the last 5 years, we have<br />
observed more water in our streams<br />
during the summer months of July<br />
and August. We came to know that<br />
the water was too much to hold in<br />
the streams and there were incidence<br />
of floods. At first we were clueless,<br />
but after talking to the elders, we<br />
were told that at the bottom of the<br />
glaciers on top of the mountains<br />
are very big lakes which are frozen<br />
through the year, and water can be<br />
seen only in August. When we went<br />
up, we saw numerous small and big<br />
lakes which had little water due to<br />
the lake outburst, but there were<br />
some with water. This showed us that<br />
because of rising temperature, snow<br />
is melting at a faster pace.”<br />
How can climate change affect my region?<br />
>> RIS<strong>IN</strong>G TEMPERATURE<br />
MELT<strong>IN</strong>G GLACIERS<br />
Degradation of 17-25% in glacier<br />
volume<br />
Floods<br />
RA<strong>IN</strong>F<strong>ALL</strong><br />
Changing patterns and trends – intensity,<br />
number of days, area<br />
More rain within a short period – intensity<br />
will go up by 1-2 mm per day in the next 18<br />
years<br />
Cloudbursts<br />
Flash floods<br />
Siltation – farmlands and water projects<br />
destroyed<br />
Health problems<br />
Impacts on agriculture<br />
August 2010. Flood destroyed 70% of the<br />
irrigation network<br />
<strong>IN</strong> YOUR VILLAGE<br />
Local people<br />
NGOs<br />
Government representatives<br />
<strong>IN</strong> YOUR DISTRICT<br />
Media reports<br />
NGOs<br />
Government agencies –<br />
meteorological department<br />
Scientists, researchers – colleges, universities<br />
ACTION<br />
The Media Resource Centre of CSE organised a workshop for<br />
journalists and water reporters in Leh (Ladakh) to orient them<br />
towards the signs of climate change in this fragile ecosystem.<br />
The water reporters are handpicked villagers from some villages<br />
around Leh, who have been active in learning about the recent<br />
weather pattern changes in their villages. As an attempt to train<br />
them as citizen’s reporters, the MRC designed a format that can<br />
><br />
><br />
Earth getting warmer. Rise of 1 to 4.5°C<br />
Melting glaciers<br />
Health problems (new diseases, increased<br />
incidence of old diseases)<br />
Impacts on agriculture<br />
FLOODS<br />
Glacial Lake Outbursts<br />
Flash floods and landslides = destruction of<br />
infrastructure, economic loss, loss of lives and<br />
livelihoods<br />
DROUGHT<br />
Severity of droughts increased by over 20%<br />
C E N T R E F O R S C I E N C E A N D E N V I R O N M E N T<br />
Climate Change<br />
L A D A K H<br />
HOW DO <strong>WE</strong> COPE?<br />
Through institutional mechanisms set up by the government<br />
Climate change council, headed by the chief minister.<br />
State Action Plan on Climate Change -- priority to climate adaptation and mitigation<br />
interventions in healthcare, energy, transport, industry, education (awareness), waste<br />
management and poverty reduction.<br />
Agencies, such as the Ladakh Renewable Energy Development Agency (LREDA)<br />
Ask: What is the council doing? What is the adaptation strategy being worked on? What<br />
actions and interventions are being proposed? What are these agencies up to?<br />
By funding adaptation and mitigation plans<br />
State Action Plan proposes a budget of Rs 56,641 lakh for 5 years.<br />
Ask: How much is Ladakh getting out of this and where will the money be used?<br />
By being prepared for natural disasters<br />
Watch out for signs and indicators. Learn more about them. Ladakh's advantages<br />
Ask: Are there government schemes and plans to prepare the<br />
Urbanisation is beginning<br />
region for such disasters? What kind of official support<br />
– opportunity to do it<br />
machinery and local governance systems exist?<br />
right, take steps to offset<br />
climate impacts<br />
By encouraging sustainable urbanisation<br />
Practices traditional<br />
Better energy, water and waste management. Encourage<br />
systems<br />
public transport. Use eco-friendly fuels.<br />
Ask: What steps have been taken? What results have they<br />
Has robust and active<br />
shown?<br />
local governance and<br />
community systems<br />
By generating livelihoods and employment<br />
Has the political and<br />
Climate change and disasters lead to changes and even loss in<br />
administrative power to<br />
livelihoods. Map these changes.<br />
regulate ways of life for<br />
Ask: What alternative livelihoods have been provided, and<br />
mitigating climate impacts<br />
how? Have they benefitted the affected people?<br />
By encouraging traditional systems<br />
Of water management, for instance.<br />
Ask: Find out what these systems are, who are their practitioners, where are they followed,<br />
and how successful they have been<br />
How do I report on it?<br />
NOW, HOW DO YOU ANALYSE<br />
THIS <strong>IN</strong>FORMATION?<br />
HAS LADAKH SUCCEEDED <strong>IN</strong><br />
MEET<strong>IN</strong>G THE <strong>CLIMATE</strong> CHANGE<br />
CH<strong>ALL</strong>ENGE?<br />
Are there enough noticeable impacts of<br />
climate change? Sometimes, these are not<br />
acute enough, giving rise to the perception<br />
that it is a distant threat.<br />
Is enough information on local impacts of<br />
climate change available? Do people,<br />
officials and researchers understand these<br />
impacts?<br />
What kind of media attention have local<br />
climate change issues received? Is it<br />
adequate?<br />
Is the local administration serious about<br />
tackling impacts of climate change?<br />
Analyse the global climate change forecasts<br />
from the local perspective. For instance,<br />
examine a report on glacier melting from<br />
an agency like the IPCC, and look at how it<br />
links to agriculture in Ladakh.<br />
What kind of development programmes<br />
has the government initiated? Can these –<br />
such as water conservation programmes –<br />
be treated as climate change adaptation<br />
programmes?<br />
<strong>IN</strong>FORMATION – FROM WHERE AND HOW?<br />
SOURCES • RESEARCH • DATA • VERIFICATION<br />
<strong>IN</strong> YOUR STATE<br />
NATIONAL<br />
State action plans<br />
Government plans and programmes – such as the National<br />
Action Plan on Climate Change<br />
Government agencies – ministries, meteorological<br />
department,<br />
Government agencies – ministries, meteorological department,<br />
Scientists, researchers – colleges, universities, research centres<br />
Scientists, researchers – colleges, universities, research centres<br />
Media reports<br />
Media reports<br />
NGOs<br />
NGOs<br />
Finally,<br />
your<br />
checklist<br />
Identify the issue.<br />
Decide on the story<br />
objective.<br />
Identify your sources of<br />
information.<br />
Make the structure –<br />
what is the peg or the<br />
problem?<br />
Is science connecting it<br />
to climate change?<br />
How are people coping?<br />
Cross-check and verify<br />
your information.<br />
Analyse your findings.<br />
Conclude.<br />
Write your headline.<br />
Write an introduction.<br />
Identify your photos,<br />
images and graphics, if<br />
any.<br />
Compile your list of<br />
resources and references<br />
<strong>IN</strong>TERNATIONAL<br />
Reports from international organisations<br />
Scientists, researchers – colleges, universities,<br />
research centres<br />
Media reports<br />
NGOs<br />
be carried to the field to do thorough research (see above). As<br />
an orientation towards issues such as climate change, which<br />
has become a part of their lives, but more importantly how to<br />
write about their indicators and signs so that there is some<br />
information engaging the public imagination, our attempt was to<br />
give them basic story writing skills, along with documenting the<br />
research at the ground level through them.<br />
Further information at www.overconsumption.eu
Bangladesh:<br />
Rising sea<br />
level and<br />
cyclons<br />
Shadu Charan Mondol<br />
The dyke of<br />
Shingertoly<br />
© Dietmar Mirkes<br />
© Dietmar Mirkes<br />
“My name is Shadu Charan Mondol.<br />
I am 72 years old and I live in<br />
Shingertoly close to the river<br />
Malancha in Bangladesh. My house<br />
is built on a dyke (see on the left of<br />
the photo). It has been destroyed six<br />
times already because the dyke didn’t<br />
hold. With the rise of the tide, the<br />
sea pushes more and more up the<br />
river. The water level started rising 60<br />
years ago, but in the last 10 years this<br />
rise has become stronger. The spring<br />
tides that occur in June and July are<br />
even more dangerous; they cause the<br />
highest water levels. We have already<br />
been forced many times to rebuild the<br />
dyke farther away from the river, but<br />
this is an ongoing problem and there is<br />
no place left for us to move further.”<br />
(March 2009)<br />
July 2009: The Mondol family in Shingertoly<br />
after the cyclon Aila.<br />
Shadu Charan Mondol died in 2012<br />
© Caritas Bangladesh<br />
SCIENTIFIC BACKGROUND:<br />
SEA LEVEL RISE<br />
The global sea level rise affects Bangladesh<br />
to a much greater degree than the global<br />
average because of its geographical position:<br />
the Bengal SAARC Meteorological Research<br />
Council discovered, based on data from the<br />
last 22 years, that the sea level rises around<br />
3 - 6 mm per year.<br />
A lot of Bangladesh’s territory is situated<br />
less than 2 meters above sea level and the<br />
sea can easily finger the land by the rivers.<br />
So, sea level rise causes a salinisation of the<br />
phreatic water in the coastal area and in the<br />
lower reaches of the rivers.<br />
India<br />
Bangladesh<br />
CO 2<br />
e emissions<br />
in tons per<br />
capita in 2010<br />
... AND RIS<strong>IN</strong>G <strong>IN</strong>TENSITY<br />
OF CYCLONS<br />
The most homicidal storm surges during<br />
the 20th century worldwide have occurred<br />
in the Bay of Bengal on the coasts of India,<br />
Bangladesh and Burma, where extreme<br />
water levels are driven by tropical cyclones :<br />
Sidr in 2007, Nargis in 2008 and Aila in 2009<br />
killed several hundred thousand people, due<br />
to the storm and the accompanying surge.<br />
The frequency of intense cyclones in the Bay<br />
of Bengal and their intensity during the end<br />
of the monsoon season until November have<br />
been increasing.<br />
15<br />
14<br />
13<br />
12<br />
11<br />
10<br />
9<br />
8<br />
7<br />
6<br />
5<br />
4<br />
3<br />
2<br />
1<br />
0<br />
WorldRiskIndex<br />
2012 VERY<br />
LOW<br />
EU27<br />
10.0<br />
Bangladesh<br />
1.1<br />
World<br />
7.3<br />
LOW MEDIUM HIGH VERY<br />
HIGH<br />
Further information at www.overconsumption.eu
Luxembourg:<br />
Summer<br />
droughts<br />
Jeff Rohen<br />
Rancher in Insenborn in Islek,<br />
Luxembourg’s wettest and<br />
coldest region.<br />
Summer<br />
drought 2011 in<br />
the Islek region<br />
near Walsdorf<br />
© Dietmar Mirkes, ASTM / CA Luxembourg<br />
© Guy Lambert, Walsdorf<br />
Ours is a very thin, rocky soil on<br />
slate. It doesn’t hold water and so<br />
we need regular rain, otherwise<br />
it dries out very quickly. The early<br />
summer of 2011 was extremely<br />
dry, and we had to buy hay for the<br />
cattle in 2011. But in the winter<br />
and spring it has been raining more,<br />
and last spring a heavy storm<br />
swept away our neighbour’s potato<br />
fields that lay on a slope. In the<br />
1980s, twice storms removed<br />
the roof of the barn, but the last<br />
few years it has been quieter. I<br />
also have the impression that the<br />
weather in the autumn is milder; it<br />
also seems that weather patterns<br />
change more quickly, are more<br />
irregular and that temperatures<br />
vary more than before.<br />
SCIENTIFIC BACKGROUND<br />
In Luxembourg, the average long-term temperature rose from 8.3°C, over the three<br />
decades between 1961 and 1990, to 9.2°C between 1981 and 2010, so, by 0.9°C<br />
(measured at the airport Findel) over a twenty year period; temperatures rose<br />
particularly during winter. Vegetation periods are approximately two weeks longer now.<br />
As a result of more frequent westerly winds during the winter, since the 1980s, winter<br />
precipitation has increased, while summers have become drier. This resulted mainly<br />
as of the 1990s during winter in higher water levels in rivers and increased flooding.<br />
In the summer months, lower<br />
water levels and more frequent<br />
droughts have led to increased<br />
water shortage. The risk of soil<br />
erosion continues to rise.<br />
OTHER IMPLICATIONS<br />
OF <strong>CLIMATE</strong> CHANGE<br />
Over the past 50 years, storms<br />
have become more common<br />
and stronger («Kyrill» wrecked<br />
great damage in January<br />
2007). Warming leads to earlier<br />
flowering plants and bird<br />
breeding and the migration of<br />
animals and plants from the<br />
Mediterranean area.<br />
Further information at www.overconsumption.eu<br />
Luxembourg<br />
CO 2<br />
e emissions<br />
in tons per<br />
capita in 2010<br />
15<br />
14<br />
13<br />
12<br />
11<br />
10<br />
9<br />
8<br />
7<br />
6<br />
5<br />
4<br />
3<br />
2<br />
1<br />
0<br />
WorldRiskIndex<br />
2012 VERY<br />
LOW<br />
EU27<br />
10.0<br />
Luxembourg<br />
26.1<br />
World<br />
7.3<br />
LOW MEDIUM HIGH VERY<br />
HIGH
Austria:<br />
Melting<br />
alpine<br />
glaciers<br />
1927 - 1930<br />
© Alpenverein-Museum Innsbruck, OeAV<br />
Laternbild 20-I_443.jpg<br />
.<br />
Alpine huts<br />
like the<br />
“Brandenburger<br />
Haus” in Tyrol<br />
(Ötztal) have<br />
been facilitating<br />
research at alpine<br />
glaciers like<br />
the Kesselwand<br />
glacier for more<br />
than 100 years.<br />
2009.<br />
Anna Pirpamer,<br />
manager of the “Brandenburger Haus”<br />
© Anna Pirpamer<br />
© Jakob Abermann.<br />
“I have managed the hut<br />
„Brandenburger Haus“ for<br />
four years now. From year<br />
to year I have noticed that<br />
many mountains, ridges and<br />
passages which used to be<br />
either completely, or to a very<br />
large extent covered by ice and<br />
snow, now are showing a lot of<br />
unconsolidated slip rock, and<br />
the danger of falling rocks is<br />
rising.<br />
The biggest problem by far<br />
for the administration of the<br />
hut will be provoked by the<br />
disappearance of a little ice<br />
field situated right above the<br />
hut. It is from this ice field<br />
that we get our general use<br />
and drinking water. This is the<br />
only practical source for us.<br />
Once this has dissappeared,<br />
big infrastructural measures<br />
will have to be implemented to<br />
reestablish access to water.”<br />
SCIENTIFIC<br />
BACKGROUND<br />
The Kesselwandferner glacier at present is up to 140 m thick, 4400 m long and it<br />
flows between 5 and 90 m a year from an altitude of 3500 m down to 2700 m above<br />
sea level. Though still accumulating mass in its upper parts, it is losing ice mass as a<br />
whole due to accelerated melting processes in the lower parts. It is one of the 93 out<br />
of surveyed 95 glaciers in Austria that has shrunk in 2012. In the last 10 years the<br />
Kesselwandferner glacier and 2 more glaciers nearby lost 15 million m 3 of ice annually.<br />
“The reason for the retreat is the above average air temperatures in the last years.”<br />
declares Dr. Andrea Fischer, head of the Glacier Monitoring Service (of the Austrian<br />
Alpine Club).<br />
Since alpine glaciers mainly melt in summer time, it is in July and August where the<br />
melting glacial ice has a special significance: then, up to 7 % of the water in the River<br />
Danube at Passau comes from alpine glaciers.<br />
Austria<br />
Glacier mass balance (accumulation -<br />
ablation) in Ötztal - Rofenache (mean<br />
values per year in million m 3 ):<br />
5.0<br />
0.0<br />
-5.0<br />
-10.0<br />
-15.0<br />
-20.0<br />
1970-<br />
1980<br />
1980-<br />
1990<br />
1990-<br />
2000<br />
2000-<br />
2010<br />
© Institut für Meteorologie und Geophysik der Universität Innsbruck; HD Tirol/BMLFUW Abteilung VII/3 - Wasserhaushalt<br />
CO 2<br />
e emissions<br />
in tons per<br />
capita in 2010<br />
WorldRiskIndex<br />
2012<br />
15<br />
14<br />
13<br />
12<br />
11<br />
10<br />
9<br />
8<br />
7<br />
6<br />
5<br />
4<br />
3<br />
2<br />
1<br />
0<br />
VERY<br />
LOW<br />
EU27<br />
10.0<br />
Austria<br />
11.3<br />
World<br />
7.3<br />
LOW MEDIUM HIGH VERY<br />
HIGH<br />
Further information at www.overconsumption.eu
Germany:<br />
regional<br />
capital<br />
Munich<br />
Joachim Lorenz,<br />
Health and Environment Secretary<br />
and Chair of the Climate Alliance<br />
(right), and Tobias Fuchs, Head<br />
of Climate and Environment<br />
Consultancy at the DWD<br />
© DWD (Deutscher Wetterdienst)<br />
© JDWD (Deutscher Wetterdienst)<br />
The recent floods in June 2013<br />
created runoff from the river Isar<br />
of more than 8 times the normal<br />
outflow, causing the groundwater<br />
level to rise, which resulted in<br />
lower-lying parts of the city<br />
experiencing basement flooding.<br />
The sewers can not absorb heavy<br />
rainfall of 50 litres/m2 in the space<br />
of a few hours, which leads to<br />
flooding of roads. These heavy rains<br />
are predicted in regional climate<br />
models on this scale for the future.<br />
Germany<br />
Munich<br />
SCIENTIFIC BACKGROUND<br />
In Bavaria, the mean air temperature and daytime temperature will increase in<br />
the future - especially in winter - which will have a major impact on the interim<br />
storage of precipitation in the form of snow and the runoff regime of the Alpine<br />
rivers. Depending on the region of the flow, the amount of water may increase<br />
up to 35%.<br />
ACTION<br />
In recent years, the city of Munich has created extensive retention areas<br />
for future floods while doing restoration work on the Isar; at the time, new<br />
floodplains were identified for two other rivers through inter-municipal<br />
cooperation. Munich also cooperates with the German Weather Service in<br />
modeling the future urban climate. By 2015, the DWD will be collecting data<br />
and simulating the future thermal situation. Munich’s location at the edge of the<br />
CO 2<br />
e emissions<br />
in tons per<br />
capita in 2010<br />
WorldRiskIndex<br />
2012<br />
VERY<br />
LOW<br />
Further information at www.overconsumption.eu<br />
15<br />
14<br />
13<br />
12<br />
11<br />
10<br />
9<br />
8<br />
7<br />
6<br />
5<br />
4<br />
3<br />
2<br />
1<br />
0<br />
EU27<br />
10.0<br />
Germany<br />
12.0<br />
World<br />
7.3<br />
LOW MEDIUM HIGH VERY<br />
HIGH<br />
Alps is particularly relevant.<br />
The information will be central<br />
to residential planning and be<br />
of help with concerns about<br />
construction and landscaping.<br />
Munich hopes to shed light on<br />
how improved air exchange,<br />
such as through fresh air<br />
corridors, can help avoid the<br />
overheating of inner-city areas<br />
- as in the «summer of the<br />
century» in 2003.
Conclusion 1 Common but differentiated responsibilites<br />
GLOBAL OVERVIEW ON PER CAPITA EMISSIONS AND RISKS<br />
30<br />
25<br />
20<br />
15<br />
10<br />
5<br />
<strong>IN</strong>DUSTRIALIZED COUNTRIES <<br />
CO 2<br />
e emissions including large-scale<br />
biomass burning (in t/capita, 2010)<br />
> DEVELOP<strong>IN</strong>G COUNTRIES<br />
WorldRiskIndex2012<br />
Source of CO 2<br />
e emissions: http://edgar.jrc.ec.europa.eu/overview.<br />
php?v=GHGts1990-2010<br />
Source of risk indexes: www.worldriskreport.org<br />
* no WR Index available<br />
The countries that bear<br />
the greatest responsibility<br />
for climate change are<br />
industrialized countries and<br />
the most vulnerable ones are<br />
developing countries. This<br />
unequal situation is the point<br />
of origin for the fundamental<br />
principle in the United Nations<br />
Framework Convention on<br />
Climate Change from 1992<br />
>>><br />
United Nations<br />
Framework Convention<br />
on Climate Change<br />
“Article 3 PR<strong>IN</strong>CIPLES<br />
1. The Parties should protect the climate system<br />
for the benefit of present and future generations<br />
of humankind on the basis of equity and in<br />
accordance with their common but differentiated<br />
responsibilities and respective capabilities.<br />
Accordingly. the developed country Parties should<br />
take the lead in combating climate change and<br />
the adverse effects thereof.”<br />
One of the meager results<br />
of the 2009 climate<br />
summit in Copenhague<br />
was the industrialized (socalled<br />
“Annex I”) countries’<br />
commitment to support<br />
developing (so-called “Non-<br />
Annex I”) countries with the<br />
amount of $100 billion per<br />
year by 2020 for mitigation<br />
and adaptation actions<br />
(“Long-term financing”).<br />
<strong>IN</strong> 2011, GLOBAL EMISSIONS<br />
TOT<strong>ALL</strong>ED 33.9 BILLION<br />
TONNES CO 2 .<br />
WHERE DO THEY COME FROM?<br />
DISTRIBUTION OF GLOBAL CO 2<br />
EMISSIONS 2011<br />
3 %<br />
Other Non-Annex I<br />
20 % 11 %<br />
India<br />
6 %<br />
16 %<br />
China<br />
Other Annex I<br />
In 2011, Annex I (industrialized) countries,<br />
which account for about 20% of the global<br />
population, produced 42% of emissions.<br />
Non-Annex I (developing) countries, which<br />
account for 80% of the global population,<br />
produced 55% of global CO 2<br />
emissions.<br />
(Source: CSEIndia, 2012)<br />
The so-called “emerging” countries’<br />
emissions are growing faster than the world<br />
average: Chinese CO 2<br />
emissions more than<br />
tripled between 1990 and 2010, and China<br />
overtook the United States in 2007 as the<br />
world’s largest annual emitter of energyrelated<br />
CO 2<br />
, although in cumulative and percapita<br />
terms the United States remains the<br />
largest emitter. (Source: IEA, CO 2<br />
Emissions<br />
from Fuel Combustion, 2012)<br />
29 %<br />
15 %<br />
POPULATION AND CO 2<br />
EMISSIONS <strong>IN</strong> 2011 (%):<br />
US<br />
EU-27<br />
International transport<br />
Source : CSEIndia 2012<br />
Developing countries Global population Global emissions<br />
China 19 % 29 %<br />
India 18 % 6 %<br />
Total Non-Annex I 80 % 55 %<br />
Industrialized countries Global population Global emissions<br />
USA 4 % 16 %<br />
EU-27 7 % 11 %<br />
Total Annex I 20 % 42 %<br />
Further information at www.overconsumption.eu
Conclusion 2<br />
Who emitted the carbon dioxide that is currently<br />
in the atmosphere causing climate change?<br />
SH<strong>ARE</strong> OF GLOBAL CO 2 EMISSIONS 1840-2006 (%)<br />
Source: ASTM based on informations from Centre for Science and Environment (2008).<br />
30 %<br />
25 %<br />
20 %<br />
15 %<br />
10 %<br />
5 %<br />
0 %<br />
USA<br />
* Includes a share of USSR emissions proportional to the Russian<br />
Federation‘s current share of former Soviet bloc emissions.<br />
Russian<br />
Federation*<br />
China<br />
Germany<br />
UK<br />
Japan<br />
France<br />
RICH COUNTRIES HID<strong>IN</strong>G BEH<strong>IN</strong>D COLLAPSED ECONOMIES<br />
• Annex I total emissions in 2011 are 6.5 % below<br />
1990 levels.<br />
• Annex I EIT (Economies in Transition: former USSR<br />
and eastern European countries) emissions in<br />
2011 are 29.5 % below 1990 levels because of the<br />
collapse of the former USSR and eastern European<br />
countries.<br />
• Annex I non-EIT (developed Western countries)<br />
emissions in 2011 are actually 4.8% above 1990<br />
levels. Rich developed countries are hiding behind<br />
the collapsed economy of the former USSR and<br />
eastern European countries in claiming they are<br />
meeting their Kyoto targets. (CSEIndia)<br />
Development in the Greenhouse? The South’s dilemma:<br />
20<br />
15<br />
10<br />
5<br />
0<br />
India<br />
Canada<br />
15.36<br />
14.35<br />
Annex I<br />
ANNUAL GLOBAL EMISSIONS<br />
The black line shows a 2°C emergency pathway, in which global greenhouse<br />
gas emissions peak by 2015 and fall to about 90 % below current levels by<br />
2050 in order to avoid a global warming above +2° C (most of developing<br />
countries want to avoid +1.5°C). The red line shows Annex 1 emissions<br />
declining to a level at 90 % of 1990 in 2050. The grey line shows, by<br />
subtraction, the emissions space that would remain for developing countries.<br />
The later industrialized countries’ emissions peak, the less space in the<br />
Poland<br />
60<br />
50<br />
40<br />
30<br />
20<br />
20<br />
atmosphere that remains for developing countries (Source: gdrights.org). 0<br />
OUR ROLE AND RESPONSIBILITY <strong>IN</strong> EUROPE<br />
A practical tool to quantify the Climate<br />
Convention’s principle of “common,<br />
but differentiated responsibility<br />
and respective capacity” is the<br />
“Greenhouse Development Rights<br />
Framework” (GDR), developed by the<br />
Stockholm Institute of Environment<br />
and EcoEquity. It indicates each<br />
country’s share in resolving the global<br />
climate problem while respecting the<br />
rights of poor people, living below a<br />
‘development threshold’, to achieve<br />
better life conditions:<br />
Population<br />
(% of global)<br />
A country’s aggregate ‘capacity to<br />
act’ is defined as the sum of all<br />
individual incomes, excluding all income<br />
below the ‘development threshold’.<br />
Responsibility is similarly defined as<br />
cumulative emissions since 1990<br />
excluding emissions that correspond to<br />
consumption below the development<br />
threshold. These measures of<br />
capacity and responsibility are then<br />
combined (weighted 50/50) into a<br />
single indicator of obligation, in a<br />
‘Responsibility Capacity Index’ (RCI).<br />
GDP<br />
(% of global)<br />
Capacity<br />
(% of global)<br />
Note: The important difference<br />
between CO 2<br />
emissions and<br />
emissions resulting from landuse<br />
change is that CO 2<br />
emissions<br />
are “importing” fossil carbon from<br />
earlier earth ages into our recent<br />
atmosphere, while emissions from<br />
land-use change just make the<br />
carbon change its position inside<br />
the carbon circle (from being<br />
stocked in present vegetation<br />
to being a gas in the present<br />
atmosphere).<br />
5.05<br />
1990<br />
2011 10.31<br />
3.56<br />
Annex I EIT<br />
(CO 2<br />
emission in billion tons)<br />
2000<br />
2010<br />
2020<br />
10.80<br />
Annex I non-EIT<br />
2030<br />
2040<br />
2050<br />
The table below shows the percentage<br />
shares for selected (groups of)<br />
countries based on CO 2<br />
e emissions<br />
including land-use change emissions<br />
for 2010 (with a development<br />
threshold of $7,500 PPP/y).<br />
Accordingly, the European Union<br />
should shoulder a quarter (24.9 %) of<br />
the combined global efforts to tackle<br />
climate change, to be achieved not<br />
only through own emissions reduction<br />
but also by supporting developing<br />
countries’ efforts to reduce emissions.<br />
Responsibility<br />
(% of global)<br />
RCI<br />
(% of global)<br />
EU-15 5.7 23.6 27.6 17.8 22.7<br />
EU-12 1.5 2.0 1.8 2.5 2.1<br />
EU-27 7.2 25.6 29.4 20.3 24.9<br />
USA 4.6 22.8 28.9 31.4 30.2<br />
China 19.6 9.8 6.3 4.4 5.4<br />
India 17.6 2.7 0.2 0.2 0.2<br />
Brazil 2.8 3.4 2.6 4.8 3.7<br />
World 100.0 100.0 100.0 100.0 100.0<br />
(GtCO 2<br />
e/yr)<br />
Source: CSEIndia 2012<br />
(Source: gdrights.org/calculator).<br />
Further information at www.overconsumption.eu
Conclusion 3 Whatyou can do:<br />
• Reduce your own emissions.<br />
• Join NGOs or other civil society movements and your municipality’s committees and<br />
councils.<br />
• Keep yourself informed and be active as national, European and global citizen, for<br />
instance by engaging on climate issues in movements and political parties.<br />
• Participate in actions, subscribe petitions to political authorities or support NGOs<br />
for sustainable global development.<br />
The following NGOs contributed to this exhibition:<br />
ASTM /<br />
Climate Alliance Luxembourg<br />
www.astm.lu /<br />
www.klimabuendnis.lu<br />
Climate Alliance<br />
Climate Alliance of European Cities<br />
with Indigenous rainforest peoples<br />
(CAI)<br />
www.climatealliance.org<br />
Climate Alliance Austria<br />
www.klimabuendnis.at<br />
CROSS<strong>IN</strong>G BORDERS<br />
Creating Space for Dialogue<br />
Crossing Borders / Denmark<br />
www.crossingborders.dk<br />
Nadace Partnerstvi / Czech R.<br />
www.nadacepartnerstvi.cz<br />
Friends of the Earth-CEPA / Slovakia<br />
www.priateliazeme.sk/cepa<br />
Védegylet Egyesület / Hungary<br />
wwvedegylet.hu<br />
Formabiap-Aidesep / Peru<br />
www.formabiap.org<br />
FOIRN / Brazil<br />
www.foirn.org.br<br />
EcoCiencia / Ecuador<br />
www.ecociencia.org<br />
ARFA / Burkina Faso<br />
www.arfa-ong.org<br />
RDGRN / Niger<br />
www.cesao-ai.org<br />
CSE / India<br />
www.cseindia.org<br />
The exhibition was co-financed by EuropeAid: http://ec.europa.eu/europeaid<br />
THANK YOU VERY MUCHFORYOURATTENTION!<br />
Further information at www.overconsumption.eu