
You also want an ePaper? Increase the reach of your titles
YUMPU automatically turns print PDFs into web optimized ePapers that Google loves.
IAM FAST-SCREEN MINI COLUMN<br />
Excellent Correlation To<br />
Traditional Methods<br />
The traditional means of predicting permeability<br />
include use of Caco-2 cell line cultures, intestinal<br />
tissue, or liposome assays. These are laborious<br />
and costly to perform.<br />
Data obtained from the IAM Fast-Screen Mini<br />
Column correlate well to data obtained from<br />
traditional assays. This is summarized in table 2.<br />
Correlation (r)<br />
Number of with IAM<br />
Compounds Fast-Screen<br />
Method Evaluated Mini Column<br />
Partitioning into liposomes 23 0.831<br />
Intestinal drug permeability 12 0.839<br />
Caco-2 cell permeability 8 0.909<br />
Table 2. Comparing k’ IAM data with<br />
other methods for estimating permeability.<br />
Caco-2 Cell Correlation<br />
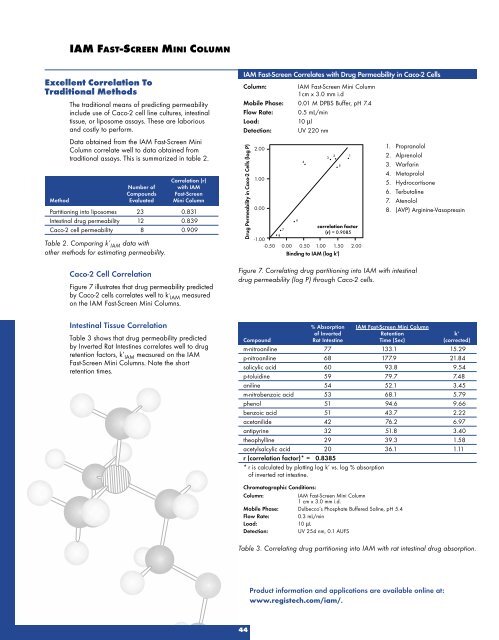
Figure 7 illustrates that drug permeability predicted<br />
by Caco-2 cells correlates well to k’ IAM measured<br />
on the IAM Fast-Screen Mini <strong>Columns</strong>.<br />
Intestinal Tissue Correlation<br />
Table 3 shows that drug permeability predicted<br />
by Inverted Rat Intestines correlates well to drug<br />
retention factors, k’ IAM measured on the IAM<br />
Fast-Screen Mini <strong>Columns</strong>. Note the short<br />
retention times.<br />
% Absorption IAM Fast-Screen Mini Column<br />
of Inverted Retention k‘<br />
Compound Rat Intestine Time (Sec) (corrected)<br />
m-nitroaniline 77 133.1 15.29<br />
p-nitroaniline 68 177.9 21.84<br />
salicylic acid 60 93.8 9.54<br />
p-toluidine 59 79.7 7.48<br />
aniline 54 52.1 3.45<br />
m-nitrobenzoic acid 53 68.1 5.79<br />
phenol 51 94.6 9.66<br />
benzoic acid 51 43.7 2.22<br />
acetanilide 42 76.2 6.97<br />
antipyrine 32 51.8 3.40<br />
theophylline 29 39.3 1.58<br />
acetylsalcylic acid 20 36.1 1.11<br />
r (correlation factor)* = 0.8385<br />
* r is calculated by plotting log k‘ vs. log % absorption<br />
of inverted rat intestine.<br />
Chromatographic Conditions:<br />
Column: IAM Fast-Screen Mini Column<br />
1 cm x 3.0 mm i.d.<br />
Mobile Phase: Dulbecco’s Phosphate Buffered Saline, pH 5.4<br />
Flow Rate: 0.3 mL/min<br />
Load: 10 µL<br />
Detection: UV 254 nm, 0.1 AUFS<br />
44<br />
IAM Fast-Screen Correlates with Drug Permeability in Caco-2 Cells<br />
Column: IAM Fast-Screen Mini Column<br />
1cm x 3.0 mm i.d<br />
Mobile Phase: 0.01 M DPBS Buffer, pH 7.4<br />
Flow Rate: 0.5 mL/min<br />
Load: 10 µl<br />
Detection: UV 220 nm<br />
Drug Permeability in Caco-2 Cells (log P)<br />
2.00<br />
1.00<br />
0.00<br />
-1.00<br />
-0.50<br />
7<br />
8<br />
6<br />
4<br />
0.00 0.50 1.00 1.50 2.00<br />
Binding to IAM (log k')<br />
Figure 7. Correlating drug partitioning into IAM with intestinal<br />
drug permeability (log P) through Caco-2 cells.<br />
3<br />
2<br />
correlation factor<br />
(r) = 0.9085<br />
5<br />
Product information and applications are available online at:<br />
www.registech.com/iam/.<br />
1<br />
1. Propranolol<br />
2. Alprenolol<br />
3. Warfarin<br />
4. Metoprolol<br />
5. Hydrocortisone<br />
6. Terbutaline<br />
7. Atenolol<br />
8. (AVP) Arginine-Vasopressin<br />
Table 3. Correlating drug partitioning into IAM with rat intestinal drug absorption.