2015-04-April-Web

Create successful ePaper yourself
Turn your PDF publications into a flip-book with our unique Google optimized e-Paper software.
Real Estate Stats<br />
We define the appreciation rate by comparing the monthly average $/SF now with the same time last year. This looks<br />
particularly uninspiring right now at 0.7% for all areas & types and -0.6% for normal listings across Greater Phoenix. Sales<br />
prices really have not made much, if any, progress since <strong>April</strong> 2014.<br />
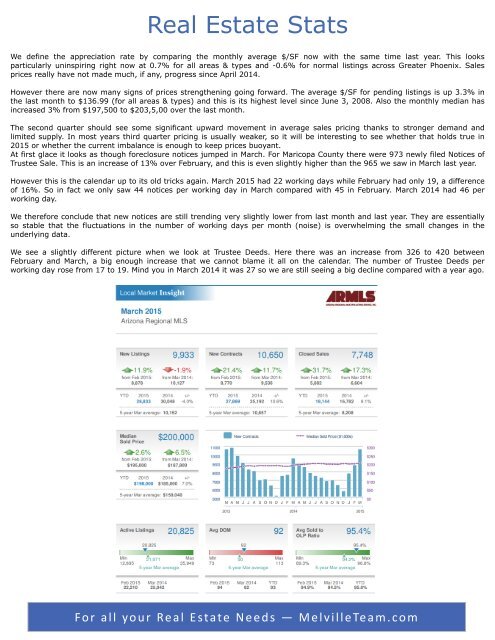
However there are now many signs of prices strengthening going forward. The average $/SF for pending listings is up 3.3% in<br />
the last month to $136.99 (for all areas & types) and this is its highest level since June 3, 2008. Also the monthly median has<br />
increased 3% from $197,500 to $203,5,00 over the last month.<br />
The second quarter should see some significant upward movement in average sales pricing thanks to stronger demand and<br />
limited supply. In most years third quarter pricing is usually weaker, so it will be interesting to see whether that holds true in<br />
<strong>2015</strong> or whether the current imbalance is enough to keep prices buoyant.<br />
At first glace it looks as though foreclosure notices jumped in March. For Maricopa County there were 973 newly filed Notices of<br />
Trustee Sale. This is an increase of 13% over February, and this is even slightly higher than the 965 we saw in March last year.<br />
However this is the calendar up to its old tricks again. March <strong>2015</strong> had 22 working days while February had only 19, a difference<br />
of 16%. So in fact we only saw 44 notices per working day in March compared with 45 in February. March 2014 had 46 per<br />
working day.<br />
We therefore conclude that new notices are still trending very slightly lower from last month and last year. They are essentially<br />
so stable that the fluctuations in the number of working days per month (noise) is overwhelming the small changes in the<br />
underlying data.<br />
We see a slightly different picture when we look at Trustee Deeds. Here there was an increase from 326 to 420 between<br />
February and March, a big enough increase that we cannot blame it all on the calendar. The number of Trustee Deeds per<br />
working day rose from 17 to 19. Mind you in March 2014 it was 27 so we are still seeing a big decline compared with a year ago.<br />
For all your Real Estate Needs — MelvilleTeam.com