The efficacy of a homemade headcap for use with cup electrodes ...
The efficacy of a homemade headcap for use with cup electrodes ...
The efficacy of a homemade headcap for use with cup electrodes ...

Create successful ePaper yourself
Turn your PDF publications into a flip-book with our unique Google optimized e-Paper software.
สงขลานครินทร์เวชสาร สายครอบศีรษะที ่ประกอบเองในการตรวจ EEG<br />
4<br />
ปีที่ 23 ฉบับที่ 1 ม.ค.-ก.พ. 2005 ซ่อนกลิ่น โอวาทฬารพร, สุวรรณา เศรษฐวัชราวนิช<br />
Twenty subjects in each group were arbitrarily chosen<br />
since there are no data regarding this type <strong>of</strong> comparative<br />
study available.<br />
Student T-test and chi-square test were employed <strong>for</strong><br />
statistical analysis where appropriate.<br />
Results<br />
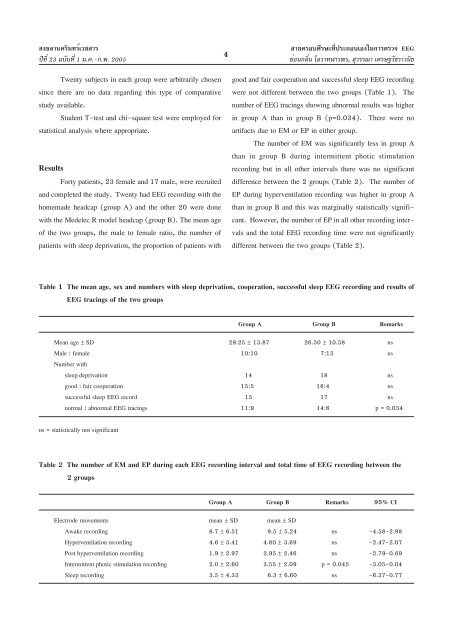
Forty patients, 23 female and 17 male, were recruited<br />
and completed the study. Twenty had EEG recording <strong>with</strong> the<br />
<strong>homemade</strong> <strong>headcap</strong> (group A) and the other 20 were done<br />
<strong>with</strong> the Medelec R model <strong>headcap</strong> (group B). <strong>The</strong> mean age<br />
<strong>of</strong> the two groups, the male to female ratio, the number <strong>of</strong><br />
patients <strong>with</strong> sleep deprivation, the proportion <strong>of</strong> patients <strong>with</strong><br />
good and fair cooperation and successful sleep EEG recording<br />
were not different between the two groups (Table 1). <strong>The</strong><br />
number <strong>of</strong> EEG tracings showing abnormal results was higher<br />
in group A than in group B (p=0.034). <strong>The</strong>re were no<br />
artifacts due to EM or EP in either group.<br />
<strong>The</strong> number <strong>of</strong> EM was significantly less in group A<br />
than in group B during intermittent photic stimulation<br />
recording but in all other intervals there was no significant<br />
difference between the 2 groups (Table 2). <strong>The</strong> number <strong>of</strong><br />
EP during hyperventilation recording was higher in group A<br />
than in group B and this was marginally statistically significant.<br />
However, the number <strong>of</strong> EP in all other recording intervals<br />
and the total EEG recording time were not significantly<br />
different between the two groups (Table 2).<br />
Table 1 <strong>The</strong> mean age, sex and numbers <strong>with</strong> sleep deprivation, cooperation, successful sleep EEG recording and results <strong>of</strong><br />
EEG tracings <strong>of</strong> the two groups<br />
Group A Group B Remarks<br />
Mean age ± SD 29.25 ± 13.87 26.50 ± 10.58 ns<br />
Male : female 10:10 7:13 ns<br />
Number <strong>with</strong><br />
sleep deprivation 14 18 ns<br />
good : fair cooperation 15:5 16:4 ns<br />
successful sleep EEG record 15 17 ns<br />
normal : abnormal EEG tracings 11:9 14:6 p = 0.034<br />
ns = statistically not significant<br />
Table 2 <strong>The</strong> number <strong>of</strong> EM and EP during each EEG recording interval and total time <strong>of</strong> EEG recording between the<br />
2 groups<br />
Group A Group B Remarks 95% CI<br />
Electrode movements mean ± SD mean ± SD<br />
Awake recording 8.7 ± 6.51 9.5 ± 5.24 ns -4.58-2.98<br />
Hyperventilation recording 4.6 ± 3.41 4.80 ± 3.69 ns -2.47-2.07<br />
Post hyperventilation recording 1.9 ± 2.97 2.95 ± 2.46 ns -2.79-0.69<br />
Intermittent photic stimulation recording 2.0 ± 2.60 3.55 ± 2.09 p = 0.045 -3.05-0.04<br />
Sleep recording 3.5 ± 4.33 6.3 ± 6.60 ns -6.37-0.77