Predicting the past - Tilburg University, The Netherlands
Predicting the past - Tilburg University, The Netherlands
Predicting the past - Tilburg University, The Netherlands

You also want an ePaper? Increase the reach of your titles
YUMPU automatically turns print PDFs into web optimized ePapers that Google loves.
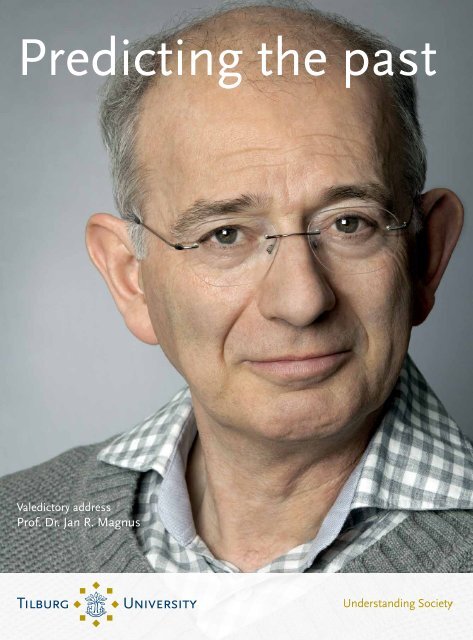
<strong>Predicting</strong> <strong>the</strong> <strong>past</strong><br />
Valedictory address<br />
Prof. Dr. Jan R. Magnus
Jan R. Magnus is research professor of econometrics at <strong>the</strong> <strong>Tilburg</strong> School of Economics<br />
and Management (TiSEM), member of <strong>the</strong> Department of Econometrics and Operations<br />
Research, and research fellow of CentER. He is (co)author of eight books and over one hundred<br />
scientific papers related to econometrics, statistics, matrix algebra, environmental economics,<br />
risk and catastrophe, national accounts estimation, history, methodology, and sport statistics.<br />
Magnus completed grammar school (Gymnasium-β) in 1966, spent one year at <strong>the</strong> Albert<br />
Schweitzer College in Switzerland studying music, philosophy and literature, and started his<br />
studies in econometrics at <strong>the</strong> <strong>University</strong> of Amsterdam in 1967. After a temporary switch to<br />
philosophy and logic, he obtained his M.Sc. (doctoraalexamen) in econometrics (cum laude) in<br />
1975, and his PhD in 1981, both at <strong>the</strong> <strong>University</strong> of Amsterdam.<br />
He worked as research assistant at <strong>the</strong> Institute of Actuarial Science and Econometrics, <strong>University</strong><br />
of Amsterdam, and as research fellow at <strong>the</strong> Economic Institute, Leyden <strong>University</strong>. From 1977–<br />
1979 Magnus held a scholarship from <strong>the</strong> Ne<strong>the</strong>rlands Organization for <strong>the</strong> Advancement of<br />
Pure Research (ZWO). In 1979 he was appointed assistant professor at <strong>the</strong> Department of<br />
Economics, <strong>University</strong> of British Columbia in Vancouver, and in 1981 as lecturer (later senior<br />
lecturer and reader) at <strong>the</strong> London School of Economics. In 1988 Magnus was appointed senior<br />
research fellow at CentER, <strong>Tilburg</strong> <strong>University</strong>, and in 1996 as research professor of econometrics<br />
in <strong>the</strong> Department of Econometrics and Operations Research.<br />
His visiting appointments include <strong>University</strong> of California, San Diego (1989); New Economic<br />
School, Moscow (1993); Tel Aviv <strong>University</strong> (1999); Université de Montréal (2002); European<br />
<strong>University</strong> Institute, Florence (Jean Monnet Scholar, 2004); <strong>University</strong> of Tokyo (2007); Chinese<br />
Academy of Sciences, Beijing, Xiamen <strong>University</strong>, and City <strong>University</strong> of Hong Kong (2008);<br />
Australia and New Zealand lecture tour (2010); and EIEF, Rome (2012, 2013).<br />
Magnus held many editorial responsibilities, including Econometric <strong>The</strong>ory, Computational<br />
Statistics and Data Analysis, and Journal of Multivariate Analysis; was a member of <strong>the</strong> International<br />
Advisory Board at <strong>the</strong> New Economic School in Moscow; and was appointed Fellow of <strong>the</strong><br />
Journal of Econometrics in 1995. He was awarded <strong>the</strong> Econometric <strong>The</strong>ory Award in 1997 and <strong>the</strong><br />
Philip Swallow Prize in 2012.
<strong>Predicting</strong> <strong>the</strong> <strong>past</strong><br />
Valedictory address<br />
Delivered in abbreviated form<br />
at <strong>Tilburg</strong> <strong>University</strong><br />
on June 14, 2013<br />
<strong>Predicting</strong> <strong>the</strong> <strong>past</strong> 1
© Jan R. Magnus, 2013<br />
ISBN: 978-94-6167-154-7<br />
Homepage: www.janmagnus.nl<br />
All rights reserved. This publication is protected by copyright, and permission must be obtained from <strong>the</strong><br />
publisher prior to any reproduction, storage in a retrieval system, or transmission in any form or by any<br />
means, electronic, mechanical, photocopying, recording or o<strong>the</strong>rwise.<br />
www.tilburguniversity.edu
<strong>Predicting</strong> <strong>the</strong> <strong>past</strong><br />
<strong>Predicting</strong> <strong>the</strong> <strong>past</strong><br />
<strong>Predicting</strong> <strong>the</strong> <strong>past</strong> 3
Pablo Picasso: <strong>The</strong> artist and his model. From Le Chef-d’Oeuvre Inconnu, text by Honoré de Balzac, illustrations<br />
by Pablo Picasso, Paris: Ambroise Vollard, 1931.<br />
4 <strong>Predicting</strong> <strong>the</strong> <strong>past</strong>
Prelude<br />
Mr. Rector Magnificus, colleagues, former and current students, family, friends, and<br />
o<strong>the</strong>rs (enemies perhaps) who have taken <strong>the</strong> trouble to come and attend this lecture.<br />
Ever since I started teaching, now more than forty years ago, I realized — based on my<br />
own experience as a student — that a good lecture should have two ingredients. First,<br />
it should not assume that students remember anything from <strong>the</strong> previous lecture; and<br />
second, that it should take into account that students have an attention span of ten<br />
minutes maximum. After ten minutes <strong>the</strong>re should be an anecdote or something else to<br />
make <strong>the</strong> students feel relaxed and keep <strong>the</strong>m awake. In <strong>the</strong> beginning of my career I did<br />
not yet follow <strong>the</strong>se rules and consequently many of my students did fall asleep, which is a<br />
little disturbing, especially when <strong>the</strong>y sit on <strong>the</strong> front row and snore loudly.<br />
<strong>The</strong> current lecture has <strong>the</strong> advantage that <strong>the</strong>re was no previous lecture, so you don’t<br />
have to remember anything. Regarding <strong>the</strong> second ingredient I have brought Pieter<br />
Nieuwint along. <strong>The</strong> locals know of course that Pieter was for many years <strong>the</strong> driving force<br />
behind <strong>the</strong> famous KUB cabaret. For today’s visitors from outside <strong>Tilburg</strong> it may be useful<br />
to explain that Pieter was for many years <strong>the</strong> driving force behind <strong>the</strong> famous KUB cabaret.<br />
My lecture today consists of 16 little blocks, each of which is independent of <strong>the</strong> o<strong>the</strong>r,<br />
and Pieter will keep count on where we are, so that at each point you know how many<br />
more blocks <strong>the</strong>re are to go.<br />
<strong>Predicting</strong> <strong>the</strong> <strong>past</strong>. Surely that should be easy. <strong>The</strong> <strong>past</strong> has no secrets. It is <strong>the</strong> future<br />
that is dark and obscure. It may come as a shock to many of you to learn that an<br />
econometrician’s job is to predict <strong>the</strong> <strong>past</strong>. To understand what happened in <strong>the</strong> <strong>past</strong>, why<br />
it happened, how it happened, which model could best describe it, this is all an essential<br />
— arguably <strong>the</strong> essential — part of <strong>the</strong> art of economic modeling and estimation.<br />
For example, if I conduct a survey among one thousand academics asking <strong>the</strong>m <strong>the</strong>ir<br />
income in <strong>the</strong> previous year and how much of this <strong>the</strong>y consumed and how much <strong>the</strong>y<br />
saved, <strong>the</strong>n I can estimate <strong>the</strong> relationship between consumption and income for this<br />
group, <strong>the</strong> so-called consumption function. <strong>The</strong>n, if you give me <strong>the</strong> income of some o<strong>the</strong>r<br />
academic in <strong>the</strong> previous year, I can predict his or her consumption in <strong>the</strong> previous year<br />
and also <strong>the</strong> uncertainty of my prediction. This is predicting <strong>the</strong> <strong>past</strong>, and it is not easy.<br />
<strong>Predicting</strong> <strong>the</strong> <strong>past</strong> 5
But suppose you want me to predict this academic’s next year’s consumption, which is<br />
<strong>the</strong> sort of thing often asked from an econometrician. This is even more difficult, because<br />
in addition to predicting <strong>the</strong> <strong>past</strong>, I now also need two fur<strong>the</strong>r ingredients, namely <strong>the</strong><br />
academic’s next year’s income (which of course we don’t know) and an assumption that<br />
<strong>the</strong> changes in <strong>the</strong> economy do not affect <strong>the</strong> consumption function. Our ignorance about<br />
<strong>the</strong>se two fur<strong>the</strong>r ingredients makes predicting <strong>the</strong> future a hazardous exercise.<br />
Never<strong>the</strong>less, as Søren Kierkegaard wrote, while life can only be understood backwards,<br />
it must be lived forwards. So, this challenge needs to be faced. But not today. In today’s<br />
lecture, I shall attempt to understand and describe my own <strong>past</strong> and tell you a little bit of<br />
<strong>the</strong> things that have occupied me during all <strong>the</strong>se years. Only at <strong>the</strong> end of <strong>the</strong> lecture will<br />
I attempt to predict my future.<br />
My academic life consisted of three main periods: my student days at <strong>the</strong> <strong>University</strong> of<br />
Amsterdam, my junior academic life at <strong>the</strong> London School of Economics, and my senior<br />
academic life here in <strong>Tilburg</strong>.<br />
Matrix calculus<br />
My first two scientific interests were maximum likelihood estimation and matrix calculus.<br />
My interest in matrix calculus was inspired by Heinz Neudecker, who taught a graduate<br />
class on <strong>the</strong> subject around 1973 which I attended. I was puzzled and fascinated, and<br />
subsequently Heinz and I worked toge<strong>the</strong>r for fifteen years, culminating in many papers<br />
and eventually, in 1988, in a monograph, <strong>the</strong> publication of which is still one of <strong>the</strong><br />
highlights of my academic life.<br />
What is matrix calculus? Most people are familiar with high-school calculus: <strong>the</strong> derivative<br />
of x 2 is 2x, for example. But suppose now that this function f depends on several variables,<br />
say x 1<br />
, …, x n<br />
. And suppose that you have not one function, but several, say f 1<br />
, …, f m<br />
. <strong>The</strong>n<br />
we move from high-school calculus to vector calculus. <strong>The</strong> derivative is now a matrix, that<br />
is an array of functions, in this case with m rows and n columns.<br />
6 <strong>Predicting</strong> <strong>the</strong> <strong>past</strong>
So far <strong>the</strong>re are no new problems. Vector calculus is well established and well understood.<br />
But suppose next we want to know <strong>the</strong> second derivative, that is <strong>the</strong> derivative of <strong>the</strong><br />
derivative, <strong>the</strong> so-called Hessian. <strong>The</strong>n we need to differentiate <strong>the</strong> first derivative, which<br />
is a matrix. How do we do that? Or suppose <strong>the</strong> functions that we start off with are<br />
arranged in a matrix, not in a vector, for example <strong>the</strong> inverse function F(X)=X -1 .<strong>The</strong>n we<br />
require a <strong>the</strong>ory of matrix calculus.<br />
<strong>The</strong> <strong>the</strong>ory that Heinz and I developed is based on two pillars. First, we employ<br />
differentials, not derivatives, and this has <strong>the</strong> advantage that <strong>the</strong> dimensions do not grow<br />
as we differentiate. <strong>The</strong>y always stay <strong>the</strong> same: <strong>the</strong> differential of a matrix is a matrix of<br />
<strong>the</strong> same dimension. Second, we transform matrix functions to vector functions (and in<br />
<strong>the</strong> end we transform <strong>the</strong>m back), so that we can employ <strong>the</strong> existing <strong>the</strong>ory of vector<br />
calculus.<br />
This may sound easy (at least to <strong>the</strong> ma<strong>the</strong>matically inclined amongst you), and in <strong>the</strong> end<br />
it is quite easy, but it took us fifteen years to put it all toge<strong>the</strong>r in a satisfactory framework.<br />
Not only did we have to understand and develop calculus in <strong>the</strong> context of differentials,<br />
but we also had to fight with colleagues who had invented <strong>the</strong>ir own ad-hoc methods,<br />
not ma<strong>the</strong>matically correct because not based on <strong>the</strong> underlying concept of derivative.<br />
Even today this battle is not completely won, and I recently called <strong>the</strong>se o<strong>the</strong>r definitions<br />
and methods ‘derisatives’ (instead of derivatives), not causing much amusement in <strong>the</strong>se<br />
circles.<br />
At <strong>the</strong> end of this long period I had become an expert in matrices and matrix calculus,<br />
and I could have stayed with this subject for <strong>the</strong> rest of my career. Maybe I should have<br />
done that. But I did not see any major new challenges in this field. It was time to change<br />
subject.<br />
Maximum likelihood and asymptotic <strong>the</strong>ory<br />
Maximum likelihood is a <strong>the</strong>ory of estimation, probably <strong>the</strong> best-known <strong>the</strong>ory of<br />
estimation. Estimation is at <strong>the</strong> heart of econometrics. Consider <strong>the</strong> following problem.<br />
<strong>Predicting</strong> <strong>the</strong> <strong>past</strong> 7
Suppose I wish to measure a table. Being too lazy to do it myself I hire a research<br />
assistant. <strong>The</strong> assistant takes 100 measurements of <strong>the</strong> length and <strong>the</strong> width of<br />
<strong>the</strong> table. <strong>The</strong>n, because he thinks that I am interested in <strong>the</strong> area of <strong>the</strong> table, he<br />
multiplies for each observation <strong>the</strong> length and <strong>the</strong> width, and throws <strong>the</strong> underlying<br />
measurements away. This gives me 100 measurements of <strong>the</strong> area. But I am not<br />
interested in <strong>the</strong> area. I want to estimate <strong>the</strong> length and <strong>the</strong> width of <strong>the</strong> table. Can<br />
I do this from <strong>the</strong>se 100 measurements of <strong>the</strong> area?<br />
It was shown by Tom Ro<strong>the</strong>nberg that indeed we can. He also showed something else,<br />
arguably even more interesting, namely this. If <strong>the</strong> research assistant is very sloppy, <strong>the</strong>n<br />
clearly his measurements will be bad and we will get a lot of variation in <strong>the</strong> estimates<br />
of <strong>the</strong> area. To estimate <strong>the</strong> length and width from such noisy data is <strong>the</strong>n difficult. If<br />
on <strong>the</strong> o<strong>the</strong>r hand <strong>the</strong> research assistant is perfect, <strong>the</strong>n he makes no errors and all<br />
measurements are exact. This results in 100 identical measurements of <strong>the</strong> area, so in<br />
fact we have only one measurement. From this one measurement, we could not possibly<br />
recover <strong>the</strong> length and <strong>the</strong> width of <strong>the</strong> table. Hence, both too much and too little<br />
sloppiness is bad. <strong>The</strong>re exists an optimal level of sloppiness of research assistants, and<br />
this optimum can be calculated.<br />
What this story really illustrates is that measurement error is not necessarily a bad thing.<br />
Much can be learned from it if we are willing to put some structure on <strong>the</strong> error process.<br />
<strong>The</strong>n, measurement error reveals more than that it hides.<br />
I was fortunate to work on maximum likelihood with Risto Heijmans of <strong>the</strong> <strong>University</strong> of<br />
Amsterdam, and I learned a lot from him. He was (and is) a better statistician than I am,<br />
but I am better in writing it up, and this was essentially our division of labor.<br />
When Risto and I worked on maximum likelihood in <strong>the</strong> period 1981–1986, most of<br />
statistics had been developed for observations that are independently drawn and can be<br />
assumed to be identically distributed. This corresponds to situations where experiments<br />
can be repeated as in physics, medicine, or psychology. But in economics experiments<br />
can typically not be repeated and our observations are dependent and not identically<br />
distributed. For this more difficult class of observations we examined <strong>the</strong> behavior of <strong>the</strong><br />
maximum likelihood estimators when <strong>the</strong> number of observations becomes larger and<br />
larger, <strong>the</strong> so-called asymptotic <strong>the</strong>ory. My family and I remember with fondness Risto’s<br />
frequent visits to our house in London during this period.<br />
8 <strong>Predicting</strong> <strong>the</strong> <strong>past</strong>
Aggregation<br />
Before London, from 1979–1981, Eveline and I lived in Canada, where I worked at <strong>the</strong><br />
<strong>University</strong> of British Columbia and Eveline obtained a masters in Communication Studies<br />
at Simon Fraser <strong>University</strong>, completing her degree with a <strong>the</strong>sis later published by<br />
Cambridge <strong>University</strong> Press under <strong>the</strong> title <strong>The</strong> Bilingual Experience. We moved to Canada<br />
with one child and left two years later with two.<br />
At UBC I became interested in aggregation, possibly inspired by <strong>the</strong> growth in my family,<br />
and by Alan Woodland, a leading expert on aggregation, who was <strong>the</strong>n also working at<br />
UBC. Alan and I worked toge<strong>the</strong>r primarily on <strong>the</strong> following question. Suppose we wish to<br />
estimate or forecast something at <strong>the</strong> macro level, say <strong>the</strong> growth of a national economy.<br />
Underlying <strong>the</strong> macro economy are sectors, which toge<strong>the</strong>r make up <strong>the</strong> macro economy.<br />
Since we wish to say something about <strong>the</strong> macro economy we could work at <strong>the</strong> macro<br />
level, that is <strong>the</strong> national level, only. But we could also model <strong>the</strong> underlying sectors (<strong>the</strong><br />
micro level), using a much bigger and richer data set. <strong>The</strong> question <strong>the</strong>n is: how much do<br />
we learn from this additional information. Is it worth <strong>the</strong> trouble?<br />
At that point, I had moved to <strong>the</strong> London School of Economics and Alan had been<br />
appointed to a chair in Sydney. To make some progress, he kindly invited me for a threeweek<br />
visit. I took <strong>the</strong> cheapest possible flight, spent two nights in <strong>the</strong> air, and arrived<br />
exhausted in Sydney. But <strong>the</strong> three weeks were highly enjoyable and very productive.<br />
<strong>The</strong> answer to our question is that we don’t learn that much from <strong>the</strong> additional<br />
information. In fact, it may be counterproductive. How can that be? Is it not true that <strong>the</strong><br />
more data <strong>the</strong> better? Well, yes and no. More data are preferred over fewer data, but we<br />
also need to model <strong>the</strong>se underlying sectors and specify how <strong>the</strong>y make up <strong>the</strong> national<br />
economy. In this process we cannot avoid making modeling and specification errors, and<br />
<strong>the</strong> harm caused by <strong>the</strong>se errors may be greater than <strong>the</strong> advantage of <strong>the</strong> richer data set.<br />
More detail is not necessarily a good thing, a somewhat counterintuitive and <strong>the</strong>refore<br />
appealing idea, which I took up again in working with Jan van Tongeren on national<br />
accounts data, many years later.<br />
<strong>Predicting</strong> <strong>the</strong> <strong>past</strong> 9
Methodology<br />
You probably know <strong>the</strong> Ten Commandments, or at least some of <strong>the</strong>m. In many disciplines<br />
leading scientists have compiled <strong>the</strong> ten commandments of <strong>the</strong>ir discipline, attempting to<br />
formalize <strong>the</strong> most important rules that need to be obeyed.<br />
We also have <strong>the</strong> ‘ten commandments of econometrics,’ compiled by Peter Kennedy in<br />
2002. I was asked to comment on <strong>the</strong>se commandments, which I did. But before doing<br />
so I asked myself why <strong>the</strong>re are two tablets of stone? Surely, God could have written<br />
all ten commandments on one tablet, especially since <strong>the</strong> tablets were written on both<br />
sides (Exodus, 32:15). Personally, I like <strong>the</strong> following explanation, which offends almost<br />
everybody, an added bonus.<br />
After having written <strong>the</strong> commandments, God wonders what to do with <strong>the</strong>m. He<br />
first turns to <strong>the</strong> British, who look at <strong>the</strong> commandments and say: ‘Ah, we are not<br />
allowed to lie? This is not for us.’ Next, he turns to <strong>the</strong> Germans, who say: ‘Ach,<br />
no killing? Sorry, but no.’ <strong>The</strong>n, he tries <strong>the</strong> French: ‘Oh, we can’t sleep with o<strong>the</strong>r<br />
women?’ Finally, God turns to <strong>the</strong> people of Israel, who ask: ‘What does it cost?’<br />
‘Nothing,’ says God. ‘<strong>The</strong>n, give us two!’<br />
<strong>The</strong> econometric commandments formulated by Peter Kennedy are all concerned with<br />
methodology and relate to <strong>the</strong> question: how should I do econometrics? I followed <strong>the</strong><br />
literature on methodology and participated in workshops, but my thoughts were confused<br />
until I started to work with Mary Morgan. This was in 1995, surprisingly late considering<br />
<strong>the</strong> fact that Mary and her husband Charles had been friends of ours since I started at<br />
<strong>the</strong> LSE in 1981. Mary and I organized an exciting experiment, where we gave a number<br />
of leading researchers or research groups one data set, fully documented, and a series<br />
of questions. <strong>The</strong>y had to answer <strong>the</strong> questions while using only <strong>the</strong> data provided by us.<br />
<strong>The</strong>y could however use <strong>the</strong>ir own models and methodology. After one year — I had <strong>the</strong>n<br />
moved from LSE to <strong>Tilburg</strong> — we all came toge<strong>the</strong>r for a workshop, here in <strong>Tilburg</strong>. Each<br />
group presented its findings and we tried to figure out why some results were close to<br />
each o<strong>the</strong>r, while o<strong>the</strong>r results were far apart. We were perhaps not completely successful<br />
in obtaining <strong>the</strong> answers. I expect that most groups went home thinking that <strong>the</strong>ir results<br />
were of course <strong>the</strong> best and that <strong>the</strong> o<strong>the</strong>rs were incompetent fools. But Mary and I did<br />
not think that any of <strong>the</strong>m were fools, and we used <strong>the</strong> material for a book, published in<br />
1999, that is still close to my heart.<br />
10 <strong>Predicting</strong> <strong>the</strong> <strong>past</strong>
This book also contains a second experiment, on ‘tacit knowledge’. Tacit knowledge is <strong>the</strong><br />
sort of thing that is not written down but which <strong>the</strong> pupil learns by watching <strong>the</strong> master<br />
at work. For example, if I consult a cookbook, <strong>the</strong>n I have a hard time to prepare a dish,<br />
because I lack experience and many things are taken for granted and are not written down.<br />
<strong>The</strong> collection of <strong>the</strong>se things is called tacit knowledge. Our tacit knowledge experiment<br />
was particularly striking, because it produced results which were completely opposite to<br />
what we and everybody else had expected, namely that our colleagues who advertise <strong>the</strong>ir<br />
methods most forcefully turned out to be not <strong>the</strong> easiest but <strong>the</strong> most difficult to imitate.<br />
Interlude on intuition<br />
Research, one often hears, starts with asking <strong>the</strong> right question. When is a question <strong>the</strong><br />
right question? What does ‘right’ mean? Here we enter <strong>the</strong> domain of intuition. We need<br />
intuition to formulate a question that is relevant, excites us, and will be of interest to<br />
o<strong>the</strong>rs too, but in such a way that it is nei<strong>the</strong>r too easy (so that anybody could solve it) nor<br />
too difficult (so that you cannot solve it). We also need intuition to reduce <strong>the</strong> number of<br />
paths to solve a problem, once we have formulated it.<br />
Intuition, however, is a slippery customer and it needs constant care and attention. Poor<br />
results or counterintuitive outcomes (and <strong>the</strong>se occur all <strong>the</strong> time) should not simply be<br />
dismissed. Each time we have to ask: why do we find a result that is counterintuitive? Are<br />
<strong>the</strong> data wrong, is <strong>the</strong> model wrong, is <strong>the</strong> estimation method inappropriate? Or perhaps<br />
our intuition is wrong and <strong>the</strong> result is in fact a sensible outcome, just different from what<br />
we expected. Only <strong>the</strong>n, I am convinced, can we sharpen our intuition and avoid <strong>the</strong> same<br />
mistake next time. <strong>The</strong>n we will have learned something and this will prove useful in our<br />
future research.<br />
Consider <strong>the</strong> following case, inspired by Tversky and Kahneman’s famous article, which<br />
appeared in Science in 1974.<br />
<strong>The</strong> town of <strong>Tilburg</strong> has two hospitals, a large one and a small one. In <strong>the</strong> larger<br />
hospital 45 babies are born each day, and in <strong>the</strong> smaller hospital 15 babies are born<br />
each day. About 50% of <strong>the</strong> babies are boys, but <strong>the</strong> exact percentage varies from<br />
day to day. Sometimes it is higher than 50%, sometimes lower. Over a period of<br />
one year, each hospital records <strong>the</strong> days on which more than 60% of <strong>the</strong> babies<br />
were boys. Which hospital do you think recorded more such days?<br />
<strong>Predicting</strong> <strong>the</strong> <strong>past</strong> 11
If you are like most people, <strong>the</strong>n you would answer that <strong>the</strong> probability of obtaining more<br />
than 60% boys is about <strong>the</strong> same in each hospital. But this is not true. Sampling <strong>the</strong>ory<br />
tells us that <strong>the</strong> expected number of days on which more than 60% of <strong>the</strong> babies are<br />
boys is much greater in <strong>the</strong> small hospital than in <strong>the</strong> large one. Why? Because with more<br />
observations <strong>the</strong> precision increases and we are less likely to stray from 50%.<br />
This example is one of many where simple statistical thinking proves too difficult for <strong>the</strong><br />
majority of people. My explanation for this fact (that people find statistics particularly<br />
difficult, much more difficult than say ma<strong>the</strong>matics) has been for a long time that we are<br />
not (or hardly) exposed to statistics at school. We are exposed to ma<strong>the</strong>matics from a very<br />
young age, but not to statistics. Hence, our intuition is not developed and we make stupid<br />
errors. This was my explanation, but Daniel Kahneman has convinced me that I am wrong<br />
by presenting <strong>the</strong> following two ma<strong>the</strong>matical cases, taken from his recent book Thinking,<br />
Fast and Slow. First, this puzzle.<br />
A bat and ball cost toge<strong>the</strong>r € 1.10.<br />
<strong>The</strong> bat costs one euro more than <strong>the</strong> ball.<br />
How much does <strong>the</strong> ball cost?<br />
This is a ma<strong>the</strong>matics example, <strong>the</strong>re is no statistics in it, and a very simple one. Still,<br />
almost all of you will think that <strong>the</strong> answer is 10 cents. But it isn’t. <strong>The</strong> answer is 5 cents.<br />
<strong>The</strong> ball costs 5 cents and <strong>the</strong> bat costs € 1.05, toge<strong>the</strong>r € 1.10.<br />
Here is ano<strong>the</strong>r puzzle.<br />
All roses are flowers.<br />
Some flowers fade quickly.<br />
<strong>The</strong>refore some roses fade quickly.<br />
Is <strong>the</strong> argument correct? Most people — according to Kahneman — think it is. But it isn’t.<br />
<strong>The</strong> fact that some flowers fade quickly could mean that some roses fade quickly, but it<br />
could also mean that some flowers, <strong>the</strong> hibiscus for example, fade quickly but that roses<br />
do not fade quickly at all.<br />
So, ma<strong>the</strong>matics intuition seems not that well developed ei<strong>the</strong>r, and my own intuition<br />
about <strong>the</strong> difference between ma<strong>the</strong>matics and statistics appears to have been wrong.<br />
12 <strong>Predicting</strong> <strong>the</strong> <strong>past</strong>
Sensitivity analysis<br />
All models are wrong but some are useful. In fact we can go one step fur<strong>the</strong>r. Even if we<br />
knew <strong>the</strong> truth, that is if we knew <strong>the</strong> model that actually generates <strong>the</strong> data, we would<br />
not want to use it. More precisely, if I tell you <strong>the</strong> correct functional form of <strong>the</strong> model<br />
(but not <strong>the</strong> values of <strong>the</strong> parameters), <strong>the</strong>n in general you should not use this model in<br />
estimation or forecasting.<br />
Isn’t that strange? <strong>The</strong> reason is as follows. If we delete a few variables from this large and<br />
complex, but true, model, <strong>the</strong>n a bias will occur in <strong>the</strong> estimates. If <strong>the</strong> variables that we<br />
exclude are relatively unimportant, <strong>the</strong>n <strong>the</strong> associated parameters will be close to zero,<br />
and <strong>the</strong> bias will be small. But, since we estimate fewer parameters, <strong>the</strong>ir precision will<br />
be better. Now, while <strong>the</strong> bias depends on <strong>the</strong> values of <strong>the</strong> parameters, <strong>the</strong> estimated<br />
variance does not. So, we can get a large reduction in variance even when <strong>the</strong> deleted<br />
parameters are close to zero. We will get better estimates using <strong>the</strong> smaller model. It is<br />
acceptable, even desirable, that <strong>the</strong> smaller model captures not everything, as long as it<br />
captures <strong>the</strong> essence. This is <strong>the</strong> art of modeling. As Einstein put it: ‘As simple as possible<br />
but not simpler.’<br />
After I came to <strong>Tilburg</strong> some twenty years ago, I became interested in sensitivity analysis,<br />
and I worked in this area with two PhD students: Anurag Banerjee and Andrey Vasnev. In<br />
sensitivity analysis we do not ask <strong>the</strong> question: is it true? Instead we ask: does it matter?<br />
A model is not true or false in this way of thinking, it is useful or not useful. And this<br />
depends on <strong>the</strong> question we wish to answer. A model can be useful when we wish to<br />
answer one question, but not when we wish to answer ano<strong>the</strong>r question. Sensitivity<br />
analysis thus breaks with <strong>the</strong> standard way of thinking that <strong>the</strong>re exists a truth which we<br />
need to approximate. Instead we now realize that this truth is not absolute and depends<br />
on <strong>the</strong> question that we ask.<br />
Sensitivity analysis works like this. Suppose we have one parameter of particular interest.<br />
We estimate this parameter using various models. <strong>The</strong>se models and <strong>the</strong> associated<br />
methods of estimation depend on assumptions. <strong>The</strong> estimate of <strong>the</strong> parameter may be<br />
sensitive or not sensitive to <strong>the</strong>se underlying assumptions. If it is sensitive to a specific<br />
assumption, <strong>the</strong>n we have apparently overlooked some essential aspect in <strong>the</strong> model. If it<br />
is not sensitive, <strong>the</strong>n this assumption is harmless.<br />
<strong>Predicting</strong> <strong>the</strong> <strong>past</strong> 13
This is quite different from <strong>the</strong> traditional model selection methodology. <strong>The</strong> most<br />
important, and ra<strong>the</strong>r surprising, result that Andrey proved is that diagnostics (coming<br />
from <strong>the</strong> world of model selection) and sensitivity statistics are essentially independent.<br />
Hence, knowledge of one tells us nothing about <strong>the</strong> o<strong>the</strong>r. Clearly, this reinforces <strong>the</strong> need<br />
to take sensitivity analysis seriously.<br />
I would have liked to go one step fur<strong>the</strong>r and use sensitivity analysis to build a proper<br />
framework for specific-to-general modeling. I have an intuitive aversion against generalto-specific<br />
modeling, <strong>the</strong> most common modeling methodology. Instead I am a firm<br />
believer in specific-to-general modeling, because I believe that we should start simple<br />
and <strong>the</strong>n extend, ra<strong>the</strong>r than start general and <strong>the</strong>n shrink. But my many attempts in this<br />
direction have all led to nothing. Maybe Pieter can help me here.<br />
Pieter’s view on econometrics<br />
Music: Vincenzo De Crescenzo (1875-1964)<br />
Title: Tarantella sincera<br />
Lyrics: Pieter Nieuwint<br />
<strong>The</strong> prediction of <strong>the</strong> <strong>past</strong>, which is <strong>the</strong> <strong>the</strong>me of this oration<br />
(Finding out what happened, and not only that, but how and why),<br />
Is <strong>the</strong> art of economic modeling and estimation,<br />
Which I find incomprehensible, no matter how I try.<br />
Still, Jan Magnus has a wonderful profession,<br />
And I’m simply overwhelmed by <strong>the</strong> idea of being present at this overwhelmingly<br />
important academic session.<br />
When I hear that prediction of <strong>the</strong> <strong>past</strong><br />
Is now possible, I tend to think: at last!<br />
But one question must be asked:<br />
Is <strong>the</strong> method computationally fast?<br />
14 <strong>Predicting</strong> <strong>the</strong> <strong>past</strong>
I am much impressed by all <strong>the</strong> scientific terms he uses:<br />
Matrix calculus and asymptotic <strong>the</strong>ory and such.<br />
I admit that quite a lot of it perplexes and confuses,<br />
And it wouldn’t make a difference if it had been in Dutch.<br />
Intuition also gives me indigestion,<br />
And <strong>the</strong> question whe<strong>the</strong>r models that you use in your research are right or wrong<br />
for me is certainly too difficult a question.<br />
Oh, <strong>the</strong> orator casts a magic spell,<br />
But <strong>the</strong> things he says don’t even ring a bell.<br />
No, as far as I can tell,<br />
Magnus just does not explain it very well.<br />
I have always been intrigued by <strong>the</strong> econometric sector,<br />
And I can assure you that <strong>the</strong>re’s little that I wouldn’t give<br />
If <strong>the</strong>y made me grasp <strong>the</strong> essence of a matrix or a vector<br />
Or indeed <strong>the</strong> underlying concept of derivative.<br />
It is also quite beyond my comprehension<br />
That, whenever you employ a differential, <strong>the</strong>n <strong>the</strong> differential of a matrix is a matrix<br />
of <strong>the</strong> same dimension.<br />
I am no statistician and confess<br />
That I cannot even make a learned guess.<br />
And I may know even less<br />
After Jan’s valedictory address.<br />
<strong>Predicting</strong> <strong>the</strong> <strong>past</strong> 15
Pretesting and model averaging<br />
It is sad but none<strong>the</strong>less,<br />
I think I will progress.<br />
Let me tell you a fairy-tale.<br />
A king has twelve advisors. He wishes to forecast next year’s inflation and calls<br />
each of <strong>the</strong> advisors in for his or her opinion. He knows his advisors and obviously<br />
has more faith in some than in o<strong>the</strong>rs. All twelve deliver <strong>the</strong>ir forecast, and <strong>the</strong> king<br />
is left with twelve numbers. How to choose from <strong>the</strong>se twelve numbers? Let me<br />
provide two ways of thinking (<strong>the</strong>re are more). <strong>The</strong> king could argue: which advisor<br />
do I trust most, who do I believe is most competent? <strong>The</strong>n I take his or her advice.<br />
<strong>The</strong> king could also argue: all advisors have something useful to say, although not<br />
in <strong>the</strong> same degree. Some are cleverer and more informed than o<strong>the</strong>rs and <strong>the</strong>ir<br />
forecast should get a higher weight. Which way of thinking is better?<br />
Intuitively most people, and I also, prefer <strong>the</strong> second method, where all pieces of advice<br />
are taken into account. In standard econometrics, however, it is <strong>the</strong> first method which<br />
dominates. This method is called pretesting, while <strong>the</strong> second method is called model<br />
averaging.<br />
Let me explain. In practice, econometricians use not one model but many models. Among<br />
<strong>the</strong>se models, one is <strong>the</strong> largest and one is <strong>the</strong> smallest. Nei<strong>the</strong>r is probably <strong>the</strong> most<br />
suitable for <strong>the</strong> question at hand. If we use diagnostic tests to search for <strong>the</strong> best-fitting<br />
model, <strong>the</strong>n we need to take into account not only <strong>the</strong> uncertainty of <strong>the</strong> estimates in<br />
<strong>the</strong> selected model, but also <strong>the</strong> fact that we have used <strong>the</strong> data to select a model. In<br />
o<strong>the</strong>r words, model selection and estimation should be seen as a combined effort, not as<br />
two separate efforts. Failure to do so leads to <strong>the</strong> misleadingly precise estimates, and <strong>the</strong><br />
harm that this causes was studied by my PhD student Dmitry Danilov.<br />
Returning to my little story, <strong>the</strong> pretest estimator corresponds to <strong>the</strong> king’s argument:<br />
which advisor do I trust most, who do I believe is most competent? <strong>The</strong>n I take his or<br />
her advice. <strong>The</strong> king’s second line of argument: all advisors have something useful to say,<br />
although not in <strong>the</strong> same degree, corresponds to a method called model averaging. In<br />
pretesting we still select one model, but in model averaging we use all models in a class.<br />
Each model tells us something about <strong>the</strong> parameter of interest, and in model averaging we<br />
use all this information in a continuous manner, not in <strong>the</strong> discrete manner of pretesting.<br />
16 <strong>Predicting</strong> <strong>the</strong> <strong>past</strong>
It took me a long time to realize that <strong>the</strong> machinery we had developed for pretesting could<br />
be applied to model averaging, and that in fact model averaging is easier than pretesting.<br />
This resulted in work with two o<strong>the</strong>r PhD students, Patricia Prüfer and Wendun Wang.<br />
In model averaging <strong>the</strong> question ‘which is <strong>the</strong> correct model’ is meaningless, and some<br />
colleagues find this unappealing. But for me this is not <strong>the</strong> main issue. <strong>The</strong> main issue is<br />
<strong>the</strong> optimal estimation of <strong>the</strong> parameters of interest using all available information.<br />
With Patricia and Wendun we developed a method called ‘weighted-average least squares’,<br />
which takes full account of <strong>the</strong> fact that model selection and estimation are a joint effort.<br />
<strong>The</strong> method is computationally fast and is half-Bayesian, being based on a consistent<br />
<strong>the</strong>ory of ignorance.<br />
In developing this <strong>the</strong>ory two peculiar problems arose. <strong>The</strong> first is this.<br />
Suppose we have one observation, say x, from a normal distribution with unknown<br />
mean θ and variance one. How would you estimate θ?<br />
Almost anybody would reply: by x of course. After all, that is all we have. This seems<br />
reasonable, but <strong>the</strong> so-called ‘equivalence <strong>the</strong>orem’ proved in a joint paper with <strong>the</strong> late<br />
Jim Durbin shows that in an econometric context this would imply always selecting <strong>the</strong><br />
unrestricted (that is, <strong>the</strong> largest) model. And this is not what we do in practice. In practice<br />
we search for smaller models and for good reason. A more appropriate estimator for θ is<br />
<strong>the</strong>n given by a fraction, say λ(x) x, where λ depends on x. This leads to <strong>the</strong> next question:<br />
how do we find λ? This question puzzled me for a number of years and <strong>the</strong> answer owes a<br />
lot to Aart de Vos and John Einmahl who helped me solve statistical problems that I could<br />
not have solved by myself.<br />
<strong>The</strong> second peculiar problem that arose in this context is this.<br />
Suppose we have not one but two pieces of information on <strong>the</strong> unknown parameter<br />
θ, say x and y. Both are normally distributed with common mean θ and some known<br />
variance, not necessarily equal. How do we estimate θ?<br />
If <strong>the</strong> two variances are <strong>the</strong> same and x and y are uncorrelated, <strong>the</strong>n <strong>the</strong> answer is simply<br />
<strong>the</strong> average of x and y. If <strong>the</strong> variances are not <strong>the</strong> same, but x and y are still uncorrelated,<br />
<strong>the</strong>n <strong>the</strong> answer is some weighted average of x and y, where <strong>the</strong> weights depend on <strong>the</strong><br />
variances such that <strong>the</strong> more precise observation gets <strong>the</strong> higher weight.<br />
<strong>Predicting</strong> <strong>the</strong> <strong>past</strong> 17
But suppose that x and y are correlated. <strong>The</strong>n <strong>the</strong> answer is that we still should estimate<br />
θ as a weighted average of x and y, except that <strong>the</strong> weights do no longer necessarily lie<br />
between zero and one. This seems very puzzling.<br />
Let’s return to our king, and suppose that he has reduced <strong>the</strong> number of advisors from<br />
twelve to two. He asks his two advisors about next year’s inflation. One says 2%, <strong>the</strong> o<strong>the</strong>r<br />
says 4%. <strong>The</strong> first estimate has variance 1, <strong>the</strong> second has variance 4. If <strong>the</strong> two advisors<br />
were uncorrelated (<strong>the</strong>y don’t know each o<strong>the</strong>r and <strong>the</strong>y base <strong>the</strong>ir forecasts on different<br />
data sets), <strong>the</strong>n <strong>the</strong> king would weigh <strong>the</strong> two estimates, giving a higher weight to <strong>the</strong> first<br />
advisor because she is more accurate (has a lower variance). <strong>The</strong> answer <strong>the</strong>n is 2.5%,<br />
which is in-between 2% and 4%, but closer to two than to four, as expected. But it is more<br />
likely that <strong>the</strong> advisors are correlated, that <strong>the</strong>y do talk toge<strong>the</strong>r, and that <strong>the</strong>y use <strong>the</strong><br />
same or similar data sets. If <strong>the</strong>ir correlation is 3/4 (which is not that high), <strong>the</strong>n <strong>the</strong> king<br />
should estimate <strong>the</strong> inflation by 1.5%, and this lies outside <strong>the</strong> range indicated by <strong>the</strong> two<br />
advisors (2% and 4%).<br />
Now we have a problem. We have a result which makes ma<strong>the</strong>matical and statistical<br />
sense, but if <strong>the</strong> king goes outside <strong>the</strong> range indicated by his advisors he will surely be<br />
heavily criticized. In practice, <strong>the</strong>refore, policy recommendations do not follow <strong>the</strong> correct<br />
ma<strong>the</strong>matical procedure. Maybe this is one reason why <strong>the</strong>y are so often incorrect.<br />
Interlude on integrity<br />
What is proper scientific conduct, in general and for an econometrician in particular?<br />
Some breaches of scientific conduct, such as plagiarism or inventing your own data,<br />
are obviously wrong. But how about deleting data that give unsatisfactory results? Or<br />
adjusting your model again and again until it gives <strong>the</strong> results you want? This is also<br />
wrong, but some of it we all do and it seems to be necessary and accepted.<br />
Data are often used <strong>the</strong> way a drunkard uses a lamppost: for support ra<strong>the</strong>r than for<br />
illumination. If <strong>the</strong> lamppost does not give enough support, we fix it or we look for<br />
ano<strong>the</strong>r lamppost. This is not right. However, to define an ethical line which should not be<br />
crossed seems impossible. Instead I recommend that every published paper should have<br />
a logbook appendix, ei<strong>the</strong>r in <strong>the</strong> paper or on a website, where <strong>the</strong> author tells us <strong>the</strong> path<br />
that he or she has traveled, including <strong>the</strong> mistakes, <strong>the</strong> changes of model, and <strong>the</strong> data<br />
massaging. This will be useful for students and colleagues.<br />
18 <strong>Predicting</strong> <strong>the</strong> <strong>past</strong>
I have made this recommendation repeatedly, but as yet no econometric journal requires<br />
it and few authors take <strong>the</strong> trouble and <strong>the</strong> time to do it. In my view, we all should.<br />
National accounts estimation<br />
I believe it was Rick van der Ploeg who brought Jan van Tongeren and me toge<strong>the</strong>r, around<br />
1997. At <strong>the</strong> time, Jan was head of <strong>the</strong> Statistics Division at <strong>the</strong> United Nations in New<br />
York, and a world expert on national accounting, a subject I knew very little about.<br />
Our common interest was (and is) based on <strong>the</strong> fact that data do not simply fall to Earth<br />
like manna falls from Heaven. Instead, data are constructed by some agency like Statistics<br />
Ne<strong>the</strong>rlands or <strong>the</strong> United Nations Statistical Division. Applied economists seldom see<br />
‘raw’ data. <strong>The</strong> data that <strong>the</strong>y receive as <strong>the</strong>ir starting point have already gone through a<br />
process. This process could involve imputing missing values or balancing items coming<br />
from different sources. <strong>The</strong> researcher should of course be aware of <strong>the</strong>se facts, but very<br />
often he or she isn’t. This shows a disrespect for <strong>the</strong> data, which in my view is only too<br />
common in econometrics.<br />
Jan and I worked toge<strong>the</strong>r for more than ten years on establishing new frameworks for<br />
national accounts estimation. In <strong>the</strong>se frameworks, <strong>the</strong> data are <strong>the</strong> parameters that we<br />
need to estimate. But we know something about <strong>the</strong>se data. For example, we know <strong>the</strong>ir<br />
approximate values in previous years and we know bounds for many ratios of <strong>the</strong> data.<br />
All this information can serve as priors in a Bayesian set-up. This is where Aart de Vos,<br />
my Bayesian friend, enters. Later, Dmitry Danilov also became a partner in this team, as<br />
master programmer.<br />
In this ambitious project we developed a new <strong>the</strong>oretical Bayesian framework for national<br />
accounts estimation, and also <strong>the</strong> software required to estimate very large data sets. Jan<br />
successfully applied <strong>the</strong>se ideas in various countries, and obtained his PhD (after retiring<br />
from <strong>the</strong> United Nations) based on <strong>the</strong>se studies.<br />
<strong>Predicting</strong> <strong>the</strong> <strong>past</strong> 19
Warming and dimming<br />
We are all seeing ra<strong>the</strong>r less of <strong>the</strong> Sun. Scientists looking at five decades of sunlight<br />
measurements have reached <strong>the</strong> disturbing conclusion that <strong>the</strong> amount of solar energy<br />
reaching <strong>the</strong> Earth’s surface has gradually been falling. <strong>The</strong> effect was first spotted by<br />
Gerry Stanhill, an English scientist working in Israel, and he called <strong>the</strong> phenomenon ‘global<br />
dimming’. His research, published in 2001, met however with a skeptical response from<br />
o<strong>the</strong>r scientists. It was only recently, when his conclusions were confirmed by Australian<br />
scientists, that climate scientists woke up to <strong>the</strong> reality of global dimming.<br />
Horizon, BBC’s celebrated science program, broadcast a film about dimming in 2005,<br />
which Eveline saw and urged me to see as well. As so often before and since, Eveline kept<br />
me grounded and interested in real-life affairs. Trying to find out a little more, I noted<br />
that <strong>the</strong> people involved in this debate were all physicists. No statisticians were involved,<br />
which struck me as strange. I wondered what <strong>the</strong> statistical evidence was. <strong>The</strong>se vague<br />
thoughts started a project with Chris Muris and Bertrand Melenberg, where we tried to<br />
disentangle global warming and local dimming, using a rich and unique data set given to<br />
us by Martin Wild from <strong>the</strong> ETH in Zürich.<br />
Not one, but two effects largely determine global warming: <strong>the</strong> well-known greenhouse<br />
effect and <strong>the</strong> less well-known solar radiation effect. An increase in concentrations<br />
of carbon dioxide and o<strong>the</strong>r greenhouse gases contributes to global warming: <strong>the</strong><br />
greenhouse effect. In addition, small particles, called aerosols, reflect and absorb sunlight<br />
in <strong>the</strong> atmosphere. More pollution causes an increase in aerosols, so that less sunlight<br />
reaches <strong>the</strong> Earth (global dimming). Despite its name, global dimming is primarily a local<br />
(or regional) effect. Because of <strong>the</strong> dimming <strong>the</strong> Earth becomes cooler: <strong>the</strong> solar radiation<br />
effect. Global warming thus consists of two components: <strong>the</strong> (global) greenhouse effect<br />
and <strong>the</strong> (local) solar radiation effect, which work in opposite directions. Only <strong>the</strong> sum<br />
of <strong>the</strong> greenhouse effect and <strong>the</strong> solar radiation effect is observed, not <strong>the</strong> two effects<br />
separately.<br />
What Chris, Bertrand and I tried to do is to identify <strong>the</strong> two effects. Why? Because <strong>the</strong><br />
existence of <strong>the</strong> solar radiation effect obscures <strong>the</strong> magnitude of <strong>the</strong> greenhouse effect.<br />
What did we find? During <strong>the</strong> 43 years 1960–2002 temperature increased by an estimated<br />
0.73 0 C, which we were able to decompose as<br />
0.73 = 1.87 − 1.09 − 0.05,<br />
20 <strong>Predicting</strong> <strong>the</strong> <strong>past</strong>
namely a greenhouse effect of 1.87 0 C, a solar radiation effect of 1.09 0 C, and a remainder<br />
term of 0.05 0 C. Hence, if aerosols and solar radiation had remained at <strong>the</strong> 1959 level,<br />
<strong>the</strong>n <strong>the</strong> expected global average temperature would have been 1.09 0 C higher. <strong>The</strong> solar<br />
radiation effect is <strong>the</strong>refore important, masking 58% of <strong>the</strong> increase due to <strong>the</strong> greenhouse<br />
effect. Ignoring dimming thus causes a serious underestimation of <strong>the</strong> greenhouse effect.<br />
Our results are alarming. Fortunately, we are now in an economic crisis: less production,<br />
less pollution, less global warming.<br />
Tennis<br />
Let us turn to a happier subject. It must have been in June 1992, during <strong>the</strong> period<br />
that I was working both in London and in <strong>Tilburg</strong>, that Eveline and I were watching <strong>the</strong><br />
tennis at Wimbledon on TV and listening to <strong>the</strong> BBC commentators. We discussed and<br />
subsequently kept a record of <strong>the</strong> statements made by <strong>the</strong> commentators, for example<br />
that serving with new balls provides an advantage, that a ‘winning mood’ exists, or that<br />
top players must grow into <strong>the</strong> tournament and that <strong>the</strong>y perform particularly well at <strong>the</strong><br />
‘big’ points. We wondered whe<strong>the</strong>r <strong>the</strong>se commonly accepted ideas were true or not, so I<br />
contacted IBM to give me <strong>the</strong>ir data, which <strong>the</strong>y did.<br />
Two years later, in 1994, I was joined by Franc Klaassen, <strong>the</strong>n a student here in <strong>Tilburg</strong>,<br />
now full professor at <strong>the</strong> <strong>University</strong> of Amsterdam. For almost twenty years we did<br />
research on tennis, first on <strong>the</strong>se accepted ideas, later also on o<strong>the</strong>r — statistically more<br />
demanding — aspects of tennis, such as <strong>the</strong> existence of winning mood, how efficient top<br />
players are, and how we can best predict <strong>the</strong> outcome of a match, while <strong>the</strong> match is in<br />
progress. In <strong>the</strong> end Franc and I wrote 15 papers toge<strong>the</strong>r, most but not all about tennis.<br />
Tennis research, like all sports research, may be considered a frivolous activity, and you<br />
may well wonder why <strong>the</strong> taxpayer should support scientists engaged in such activities.<br />
You are right, but only in part. Sports data have some characteristics that make <strong>the</strong>m<br />
ideally suited for studying human behavior. <strong>The</strong>y are clean — <strong>the</strong>re are few errors in <strong>the</strong><br />
data — and <strong>the</strong> data collection is transparent and can be checked. Data in economics,<br />
psychology, and many o<strong>the</strong>r sciences are often messy and ambiguous. For economists,<br />
psychologists and o<strong>the</strong>r scientists to work with clean data provides a great opportunity<br />
and a welcome change from normal practice. If results do not come out <strong>the</strong> way <strong>the</strong>y<br />
‘should’, <strong>the</strong>n this cannot be blamed on <strong>the</strong> data. <strong>The</strong>re must be a ‘real’ explanation and<br />
we have to find it. Maybe our preconceived idea is wrong or maybe we have not applied<br />
<strong>the</strong> correct statistical method.<br />
<strong>Predicting</strong> <strong>the</strong> <strong>past</strong> 21
Given <strong>the</strong> abundance of clean sports data we can try and study human behavior in an<br />
indirect way. Let me give two examples. Suppose we wish to study whe<strong>the</strong>r judges and<br />
juries in our legal system are influenced by social pressure. Useful data from <strong>the</strong> law<br />
courts are not available, so we cannot directly study <strong>the</strong> possibility of favoritism in <strong>the</strong><br />
courts of law under social pressure. But we can study it indirectly by considering football<br />
matches and asking whe<strong>the</strong>r referees favor <strong>the</strong> home team, for example by shortening<br />
matches in which <strong>the</strong> home team is one goal ahead and leng<strong>the</strong>ning matches in which <strong>the</strong><br />
home team is one goal behind at <strong>the</strong> end of regular time. It turns out that referees tend to<br />
do this, thus favoring <strong>the</strong> home team.<br />
My second example is <strong>the</strong> question whe<strong>the</strong>r people become more cautious when pressure<br />
mounts. Franc and I analyzed this question using tennis data. Some points are more<br />
important than o<strong>the</strong>rs. Do players behave differently at <strong>the</strong> key points? <strong>The</strong>y do: <strong>the</strong>y play<br />
safer at important points. This teaches us something about human behavior, and may<br />
have a broader significance, for example in economics. If salaries of agents working in <strong>the</strong><br />
financial sector contain not only a bonus but also a substantial malus component, <strong>the</strong>n<br />
<strong>the</strong> consequences of <strong>the</strong>ir activities matter in both directions (like winning or losing a<br />
tennis match). <strong>The</strong> behavior of professional tennis players suggests that financial agents<br />
will <strong>the</strong>n pursue safer actions, reducing <strong>the</strong> possibility of a banking crisis.<br />
A few months ago Franc and I completed our book Analyzing Wimbledon, which attempts<br />
to put everything that we found toge<strong>the</strong>r in one framework and at one level. This book will<br />
appear later this year and I recommend it to you.<br />
22 <strong>Predicting</strong> <strong>the</strong> <strong>past</strong>
<strong>The</strong> Philip Swallow prize<br />
When I started as an academic, I never thought about a ‘research plan’ or a ‘career<br />
strategy’. I just studied what caught my interest, without plan or strategy. This, apparently,<br />
is all wrong. One should have a plan and stick to it, so that one works efficiently and<br />
maximizes <strong>the</strong> number of published papers.<br />
Not just <strong>the</strong> number of papers, but also — and in particular — <strong>the</strong> points associated<br />
with <strong>the</strong>se publications. <strong>The</strong>se points were quite amusing when Arie Kapteyn and Tom<br />
Wansbeek first compiled <strong>the</strong>ir celebrated list in 1980 under <strong>the</strong> name ‘A.D.S. de Schuite’,<br />
an anagram for ‘Dutch disease’. <strong>The</strong> list and subsequent lists generated a revolution in<br />
counting in Dutch economics. No doubt, some of this was much needed and beneficial.<br />
But too much counting is — in my view — counterproductive. Young scientists should<br />
study what <strong>the</strong>y find interesting and publish <strong>the</strong>ir findings in <strong>the</strong> most appropriate outlet.<br />
<strong>The</strong>y should not think about <strong>the</strong> points associated with a specific publication.<br />
To put some power behind my minority view, I instituted <strong>the</strong> Philip Swallow Prize in<br />
<strong>Tilburg</strong>. What is <strong>the</strong> Philip Swallow Prize? Who is Philip Swallow in <strong>the</strong> first place? Philip<br />
Swallow is a character in David Lodge’s 1975 novel Changing Places.<br />
Among a group of American English literature scholars, an academic from England called<br />
Philip Swallow, himself a scholar in English literature, proposes to play a game, which<br />
goes like this. Each person in turn calls out a book or play that he or she has not read. <strong>The</strong><br />
more people have read it, <strong>the</strong> more points you get. <strong>The</strong> purpose of <strong>the</strong> game is <strong>the</strong>refore<br />
not to show off and mention obscure books that nobody has read, but just <strong>the</strong> opposite.<br />
A very English game. In Lodge’s story, an untenured American academic, called Howard<br />
Ringbaum, eventually understands <strong>the</strong> game and admits that he has never read Hamlet.<br />
Of course he wins <strong>the</strong> game (but loses his job). Apparently, Lodge himself has never read<br />
War and Peace, which gives him a solid chance of winning.<br />
In <strong>the</strong> same spirit, I proposed last year to present a prize (which I named <strong>the</strong> Philip<br />
Swallow Prize) to <strong>the</strong> member or members of <strong>the</strong> econometrics group at <strong>Tilburg</strong> whose<br />
paper had been rejected by <strong>the</strong> lowest-ranked journal. What happened? I won <strong>the</strong> prize<br />
myself for my rejected publication (jointly with Mars Cramer) submitted and rejected by<br />
Economisch Statistische Berichten. Apparently I am <strong>the</strong> only one in <strong>the</strong> department whose<br />
papers get rejected by low-ranked journals. Naturally it fills me with pride to be associated<br />
with such a department.<br />
<strong>Predicting</strong> <strong>the</strong> <strong>past</strong> 23
<strong>Predicting</strong> <strong>the</strong> future<br />
Let me return to <strong>the</strong> title of my lecture: predicting <strong>the</strong> <strong>past</strong>. I have led you through a few of<br />
<strong>the</strong> highlights of my <strong>past</strong>. Is this a true account? Have I predicted <strong>the</strong> <strong>past</strong> well? Only up<br />
to a point. I have deleted a lot and mentioned only a fraction of <strong>the</strong> people I collaborated<br />
with.<br />
As all historians know, predicting <strong>the</strong> <strong>past</strong> is not easy. Of course, if we built a model based<br />
on a given data set, and <strong>the</strong>n predicted how well <strong>the</strong> model behaves using <strong>the</strong> same data,<br />
<strong>the</strong>n we would get good — possibly even perfect — results. This, however, is ridiculous,<br />
which does not mean that some of my distinguished colleagues do not engage in such<br />
practices.<br />
<strong>Predicting</strong> <strong>the</strong> <strong>past</strong> is not easy, but it is a necessary ingredient for predicting <strong>the</strong> future,<br />
that is for forecasting. Forecasting is a bit like driving a car blindfolded, following<br />
directions given by someone looking out through <strong>the</strong> back window. Take my own case.<br />
If you had wished to forecast last year what I would be doing <strong>the</strong> current year, <strong>the</strong>n you<br />
would have been fairly accurate. But how about forecasting now what I shall be doing<br />
next year? This is more difficult, because a structural break is about to occur, namely<br />
my retirement. My situation changes from being employed to being unemployed. When<br />
a structural break occurs, econometricians are assumed to help making forecasts and<br />
policy recommendations. Unfortunately, we have a hard time doing so. Maybe I will do<br />
<strong>the</strong> same as I am doing now, maybe something completely different. I’ll tell you next year.<br />
24 <strong>Predicting</strong> <strong>the</strong> <strong>past</strong>
Coda<br />
Mr. Rector Magnificus, ladies and gentlemen.<br />
Coming to <strong>the</strong> end of my lecture, I think of <strong>the</strong> people who have inspired me. My mo<strong>the</strong>r<br />
died young and did not even see me complete high school. She never met Eveline or her<br />
grandchildren. Still, fifty years after her death, my memories of her are alive and important<br />
to me. My fa<strong>the</strong>r, and Ank, his amazing second wife, both died before my inaugural<br />
lecture. <strong>The</strong>y would have enjoyed being here and I miss <strong>the</strong>m.<br />
I thank my teachers at <strong>the</strong> <strong>University</strong> of Amsterdam, my colleagues, and my students<br />
for keeping me alert, and I thank my two principal employers — <strong>the</strong> London School<br />
of Economics and <strong>Tilburg</strong> <strong>University</strong> — for providing truly inspirational working<br />
environments. I couldn’t have been more fortunate.<br />
Within <strong>Tilburg</strong> I moved office several times, being first located among <strong>the</strong> CentER<br />
professors, which was much fun, and finally among <strong>the</strong> econometrics group on <strong>the</strong> sixth<br />
floor, also much fun. This last move proved particularly fruitful. It is much underestimated<br />
how important <strong>the</strong> location of your room is within a group. If you are located in such a way<br />
that you meet casually at <strong>the</strong> coffee machine or <strong>the</strong> printer, <strong>the</strong>n <strong>the</strong> probability of joint<br />
work is much increased. In my own case, I wrote joint papers with almost everybody on<br />
<strong>the</strong> sixth floor, which would never have happened if I had been located on a different floor.<br />
I have been fortunate to be able to travel a lot. I spent much time in Moscow, helping<br />
establish <strong>the</strong> New Economic School, and recently in Japan, China, Australia, and New<br />
Zealand. I thoroughly enjoyed <strong>the</strong>se experiences and I learned a lot from being in different<br />
institutions with different customs and different priorities.<br />
<strong>Predicting</strong> <strong>the</strong> <strong>past</strong> 25
I don’t think I am a particularly easy person to work with. Still, I have had many coauthors:<br />
James, Peter, and Giuseppe<br />
Jan, Asraul, and Ashoke<br />
Henk, Roger, and Anatoly<br />
Jim, Bertrand, and Dmitry<br />
Mars, Karim, and Hiroaki<br />
John, Bahram, and Alberto<br />
Kan, Owen, and Hugo<br />
Flip, Karen, and Risto<br />
Franc, Victor, and Masako<br />
Chris, Arthur, and Franco<br />
Pavel, Erricos, and Alexei<br />
Kamlesh, Ronald, and Andrey<br />
David, Anurag, and Mary<br />
Heinz, Alan, and Otilia<br />
Tom, Wendun, and Salima<br />
Geert, Martin, and Patricia<br />
Aart, Xhinyu, and Ursula<br />
In joint scientific work, my belief is that compromises are unacceptable. What this means<br />
is not that what I think should be done irrespective of what <strong>the</strong> o<strong>the</strong>r person thinks. No,<br />
what it means is that authors should only collaborate if <strong>the</strong>y are clear about a common<br />
goal. <strong>The</strong>n, if <strong>the</strong>re is a disagreement, <strong>the</strong> question is not to win or lose <strong>the</strong> argument but<br />
ra<strong>the</strong>r to find out how it is possible that <strong>the</strong>re is a disagreement in <strong>the</strong> first place. Maybe<br />
one has not fully grasped <strong>the</strong> implications of some assumption or is confused about some<br />
aspect of <strong>the</strong> data. In figuring out such disagreements much progress can be made, and<br />
it streng<strong>the</strong>ns <strong>the</strong> partnership and improves <strong>the</strong> project. A compromise may be good in<br />
business, but not in science.<br />
26 <strong>Predicting</strong> <strong>the</strong> <strong>past</strong>
My family — Eveline, Gideon and Joyce, Hedda and Ralph, and my two grandsons Dorian<br />
and Midas — have often been taken for granted, yet <strong>the</strong>y are and always have been <strong>the</strong><br />
most important to me. My two grandsons have added a new sparkle of joy and tenderness<br />
to my and Eveline’s life, Gideon and Hedda (and <strong>the</strong>ir splendiferous partners) have made<br />
my life more intense and more complete, and it is wonderful to see <strong>the</strong>m as grown-ups<br />
and thriving in <strong>the</strong>ir work and life.<br />
My wife Eveline has now been with me for more than forty years. When we met, I had after<br />
4 1/2 years of study almost passed my ‘propedeuse’, almost completed my bachelor’s, and<br />
had just started on my masters — a combination of half-finished degrees that would not<br />
be possible now. Meeting you provided a new and much-needed focus, which has been<br />
essential to me ever since. It was <strong>the</strong> luckiest thing that ever happened to me. You have<br />
been my partner emotionally, intellectually, and musically. You continue to be <strong>the</strong> music<br />
in my life.<br />
We discussed predicting <strong>the</strong> <strong>past</strong> and predicting <strong>the</strong> future. How about predicting <strong>the</strong><br />
present? <strong>The</strong> present is that this lecture has come to an end and that drinks await you<br />
outside.<br />
I thank you for your attention.<br />
<strong>Predicting</strong> <strong>the</strong> <strong>past</strong> 27
Colofon<br />
vormgeving<br />
Beelenkamp Ontwerpers, <strong>Tilburg</strong><br />
foto omslag<br />
Ton Toemen<br />
druk<br />
PrismaPrint, <strong>Tilburg</strong> <strong>University</strong><br />
28 <strong>Predicting</strong> <strong>the</strong> <strong>past</strong>