Schol Stats and Modelling (93201) 2008 - 2012Maths
Schol Stats and Modelling (93201) 2008 - 2012Maths
Schol Stats and Modelling (93201) 2008 - 2012Maths

Create successful ePaper yourself
Turn your PDF publications into a flip-book with our unique Google optimized e-Paper software.
<strong>93201</strong>Q<br />
<strong>93201</strong>2<br />
S<br />
<strong>Schol</strong>arship <strong>2008</strong><br />
Statistics <strong>and</strong> <strong>Modelling</strong><br />
2.00 pm Saturday 22 November <strong>2008</strong><br />
Time allowed: Three hours<br />
Total marks: 48<br />
QUESTION booklet<br />
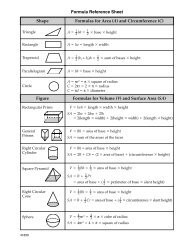
Pull out the Formulae <strong>and</strong> Tables Booklet S–STATF from the centre of this booklet.<br />
There are SIX questions in this booklet. Answer ALL questions.<br />
Write your answers in the Answer Booklet <strong>93201</strong>A.<br />
Show all working. Start your answer to each question on a new page. Carefully number each question<br />
<strong>and</strong> part question.<br />
There is a grid provided on page 25 of the Answer Booklet for answering Question Three (b)(i), <strong>and</strong><br />
another grid provided on page 26 for answering Question Six (a).<br />
Check that this booklet has pages 2–10 in the correct order <strong>and</strong> that none of these pages is blank.<br />
YOU May keep this booklet at THE END OF THE EXAMINATION.<br />
© New Zeal<strong>and</strong> Qualifications Authority, <strong>2008</strong><br />
All rights reserved. No part of this publication may be reproduced by any means without the prior permission of the New Zeal<strong>and</strong> Qualifications Authority.
2<br />
You have three hours to complete this examination.<br />
All questions are based on activities associated with a hotel owned <strong>and</strong> operated by a company called<br />
<strong>Stats</strong>mod Enterprises.<br />
QUESTION ONE : HOTEL Restaurant Spending Analysis (8 marks)<br />
(a)<br />
In an analysis of the spending at the restaurant, <strong>Stats</strong>mod Enterprises wishes to estimate the mean<br />
amount spent per person to within $4, with 99% confidence.<br />
Calculate the required minimum sample size n if the st<strong>and</strong>ard deviation of the amount spent per<br />
person has been estimated to be $9.53.<br />
(b)<br />
The restaurant has a maximum capacity of 80 diners. Previous analysis has shown that the mean<br />
total nightly takings when the restaurant is full is $4 800. A r<strong>and</strong>om sample of the size n, calculated<br />
in part (a), gave a mean amount spent per person of $56.24.<br />
Does this sample provide evidence, at the 95% level of confidence, to suggest that the mean amount<br />
spent per person has decreased? Justify your answer.<br />
(c)<br />
<strong>Stats</strong>mod Enterprises wishes to compare the mean amount spent per diner between lunch <strong>and</strong> dinner<br />
(using an identical menu) to see if it can be claimed that these means are different.<br />
Describe how to carry out a statistical procedure that would allow <strong>Stats</strong>mod to make a conclusion.<br />
State any assumption(s) that would be needed.
QUESTION TWO : Guest Satisfaction Survey (8 marks)<br />
3<br />
(a)<br />
In order to carry out a guest satisfaction survey, a systematic sample was taken from the guest<br />
database. Explain how this sample could be taken, <strong>and</strong> give both an advantage <strong>and</strong> a disadvantage<br />
of using this method.<br />
(b)<br />
Suppose a pilot survey of 50 guests gave a 78% satisfaction rate with the room service. Construct<br />
a 95% confidence interval <strong>and</strong> use it to calculate two possible minimum sample sizes that would<br />
achieve an estimate of the true satisfaction rate to within 3%, with 95% confidence. Explain the<br />
difference between your answers.<br />
(c)<br />
On average, from similar previous satisfaction surveys, 5% of the questionnaires are completed<br />
incorrectly. What is the maximum number of incorrectly completed questionnaires, out of a r<strong>and</strong>om<br />
sample of 56 returned questionnaires, that would be expected 95% of the time?
QUESTION THREE : Occupancy Rate Investigation (8 marks)<br />
4<br />
<strong>Stats</strong>mod Enterprises wishes to investigate the trend in the occupancy rate of its hotel in the period 2003<br />
to 2007. Data for the actual occupancy rate for each quarter of the years 2003 to 2007 were collected as<br />
shown in the following table. Period t = 1 is the first quarter in 2003, period t = 2 is the second quarter of<br />
2003, <strong>and</strong> so on. Deseasonalised occupancy rates were calculated to the nearest whole number <strong>and</strong> these<br />
are also shown in the table.<br />
Period<br />
t<br />
Actual<br />
occupancy rate (%)<br />
Deseasonalised<br />
occupancy rate (%)<br />
1 69.5 67<br />
2 69.0 68<br />
3 64.0 70<br />
4 71.0 69<br />
5 75.5 72<br />
6 71.0 72<br />
7 72.5 74<br />
8 74.1 73<br />
9 77.7 76<br />
10 80.1 78<br />
11 73.0 77<br />
12 78.6 77<br />
13 80.6 79<br />
14 79.5 80<br />
15 74.5 77<br />
16 80.2 79<br />
17 81.2 78<br />
18 74.8 76<br />
19 71.8 75<br />
20 71.9 71
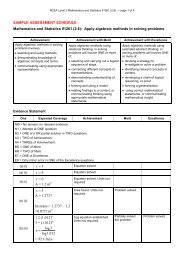
5<br />
From the data in the table the following graph was obtained.<br />
Occupancy Rates<br />
85<br />
Deseasonalised<br />
Actual<br />
80<br />
Occupancy rate %<br />
75<br />
70<br />
65<br />
60<br />
1 2 3 4 5 6 7 8 9 10 11 12 13 14 15 16 17 18 19 20 21 22 23 24 25<br />
Period t<br />
A trend line was fitted to the deseasonalised data. Its equation is y = 0.4496 t + 69.679,<br />
where y is the deseasonalised occupancy rate as a percentage.<br />
(a) Write a short paragraph to describe occupancy rates over the years 2003 to 2007.<br />
(b)<br />
Obtain a forecast for the occupancy rate in the first quarter of <strong>2008</strong> by each of the following<br />
methods:<br />
(i) Extrapolate the deseasonalised occupancy rates (%) corresponding to t = 16, 17, 18, 19 <strong>and</strong> 20.<br />
Use the grid provided on page 25 of the Answer Booklet.<br />
(ii)<br />
Use the fitted trend line.<br />
(c)<br />
Discuss any differences between your answers in part (b).
QUESTION FOUR : Minibar expenditure Analysis (8 marks)<br />
6<br />
<strong>Stats</strong>mod’s hotel has a minibar available in each of its st<strong>and</strong>ard <strong>and</strong> deluxe rooms. A minibar is a small<br />
selection of drinks <strong>and</strong> snack food for sale in the hotel room. Data about expenditure on the minibar were<br />
collected from a r<strong>and</strong>om sample of occupants in 16 st<strong>and</strong>ard rooms <strong>and</strong> a r<strong>and</strong>om sample of occupants in<br />
16 deluxe rooms, <strong>and</strong> statistics were obtained from the data, as shown in the following tables.<br />
Number of nights<br />
stayed, x<br />
Minibar expenditure<br />
for st<strong>and</strong>ard room, $y<br />
Number of nights<br />
stayed, x<br />
Minibar expenditure<br />
for deluxe room, $y<br />
1 5 1 15<br />
2 7 1 23<br />
3 12 2 180<br />
3 13 4 42<br />
4 12 4 41<br />
4 14 5 48<br />
5 14 6 59<br />
6 15 7 67<br />
6 16 8 62<br />
9 19 8 81<br />
10 17 11 90<br />
10 20 11 94<br />
11 19 12 102<br />
13 19 12 125<br />
13 18 14 131<br />
14 19 14 147<br />
Mean 14.94 Mean 81.69<br />
St<strong>and</strong>ard Deviation 4.40 St<strong>and</strong>ard Deviation 46.37
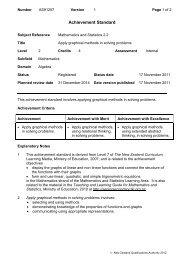
7<br />
A scatter plot of the data for st<strong>and</strong>ard rooms is shown below.<br />
25<br />
Minibar Expenditure for St<strong>and</strong>ard Rooms<br />
20<br />
Expenditure, $y<br />
15<br />
10<br />
5<br />
0<br />
0 2 4 6 8 10 12 14 16<br />
Number of nights stayed, x<br />
A scatter plot of the data for deluxe rooms is shown below.<br />
200<br />
180<br />
160<br />
Minibar Expenditure for Deluxe Rooms<br />
Expenditure, $y<br />
140<br />
120<br />
100<br />
80<br />
60<br />
40<br />
20<br />
0<br />
0 2 4 6 8 10 12 14 16<br />
Number of nights stayed, x
Two regression lines, one of which uses a log (base e) transformation of x, were fitted to the st<strong>and</strong>ard<br />
rooms data. The equations of the regression lines <strong>and</strong> their associated R 2 values are:<br />
y = 5.58 ln x + 5.23 with R 2 = 0.9274<br />
y = 0.90 x + 8.53 with R 2 = 0.7674<br />
Two regression lines were fitted to the deluxe rooms data; one of them to the complete set of 16<br />
observations, <strong>and</strong> the other to 15 observations. The equations of the regression lines (not necessarily<br />
respectively) <strong>and</strong> their associated R 2 values are:<br />
y = 5.95 x + 37.03 with R 2 = 0.3277<br />
y = 8.85 x + 5.53 with R 2 = 0.9483<br />
8<br />
Write a two-page essay that comments on the minibar expenditure by the occupants in the two types of<br />
room.<br />
As part of your essay, by making an appropriate choice of regression line from those listed above, include<br />
a prediction for the amount spent on the minibar by occupants for a stay of seven nights for each type of<br />
room. Justify your choice of regression line. Comment on the validity of your predictions. State at least<br />
two other factors that could have an influence on the amount spent on the minibar <strong>and</strong> which could form<br />
part of a more extensive analysis.
QUESTION FIVE : Bookings Analysis (8 marks)<br />
Accommodation enquiries may be made at <strong>Stats</strong>mod’s hotel either by phone, through the internet, or by<br />
fax. Enquiries are received r<strong>and</strong>omly with resulting bookings occurring r<strong>and</strong>omly as well. An analysis<br />
of enquiries <strong>and</strong> bookings was carried out. Some conclusions from this analysis are summarised in the<br />
following table.<br />
9<br />
Type of enquiry<br />
Probability of receiving this<br />
type of enquiry<br />
Probability that a booking<br />
results from this type of enquiry<br />
Phone 0.6 a<br />
Internet 0.3 a 2<br />
Fax 0.1 a 3<br />
where a is a constant such that 0 < a < 1.<br />
(a)<br />
Calculate the probability that at least 25 enquiries out of 100 came through the internet.<br />
(b)<br />
Obtain an expression, in terms of a, that gives the probability that the 10th phone call resulted in the<br />
5th booking from phone enquiries on that day. Assume that the phone calls occur independently.<br />
(c)<br />
By taking a = 0.7, calculate the percentage of enquiries that result in no booking.<br />
(d)<br />
Suppose that, when a booking resulted, there was a 75% chance it was by phone.<br />
Find the value of a.
QUESTION SIX : Designing a New Hotel (8 marks)<br />
A new hotel for <strong>Stats</strong>mod Enterprises is to have only deluxe <strong>and</strong> st<strong>and</strong>ard rooms. In designing the new<br />
hotel, the following constraints need to apply:<br />
• The maximum number of rooms is 65.<br />
• The building cost budget for the rooms has a maximum of $3 million. Building costs are<br />
$45 000 for a st<strong>and</strong>ard room <strong>and</strong> $60 000 for a deluxe room.<br />
• When the number of st<strong>and</strong>ard rooms (x) is such that 10m < x ≤ 10(m + 1), then the number of<br />
deluxe rooms (y) is such that y ≤ 5(m + 1), where m = 0, 1, 2, 3, 4.<br />
The profit for deluxe rooms is 40% greater than that for st<strong>and</strong>ard rooms.<br />
10<br />
(a)<br />
Assuming that all rooms are occupied, find the number of each type of room that should be built to<br />
ensure maximum profit.<br />
A grid is provided on page 26 of the Answer Booklet to help you answer this question.<br />
(b)<br />
<strong>Stats</strong>mod Enterprises wants to ensure maximum profit <strong>and</strong> build the maximum number of 65 rooms,<br />
but cannot do so within the $3 million building cost budget.<br />
What is the smallest required increase in this budget?<br />
(c)<br />
Suppose the mean occupancy rate for deluxe rooms is 60% <strong>and</strong> that all three constraints still apply.<br />
While still ensuring maximum profit, calculate the occupancy rate for st<strong>and</strong>ard rooms, which will<br />
give more than one solution for each type of room that should be built. Clearly state all of these<br />
solutions.