ENSO, the MJO and Atlantic Basin Rapid Intensification - Climate ...
ENSO, the MJO and Atlantic Basin Rapid Intensification - Climate ...
ENSO, the MJO and Atlantic Basin Rapid Intensification - Climate ...
You also want an ePaper? Increase the reach of your titles
YUMPU automatically turns print PDFs into web optimized ePapers that Google loves.
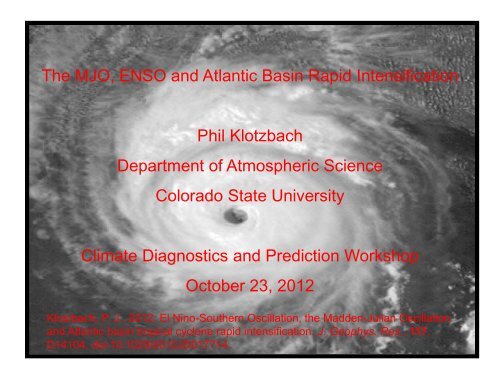
The <strong>MJO</strong>, <strong>ENSO</strong> <strong>and</strong> <strong>Atlantic</strong> <strong>Basin</strong> <strong>Rapid</strong> <strong>Intensification</strong><br />
Phil Klotzbach<br />
Department of Atmospheric Science<br />
Colorado State University<br />
<strong>Climate</strong> Diagnostics <strong>and</strong> Prediction Workshop<br />
October 23, 2012<br />
Klotzbach, P. J., 2012: El Nino-Sou<strong>the</strong>rn Oscillation, <strong>the</strong> Madden-Julian Oscillation<br />
<strong>and</strong> <strong>Atlantic</strong> basin tropical cyclone rapid intensification. J. Geophys. Res., 117,<br />
D14104, doi:10.1029/2012JD017714.
Outline<br />
Data<br />
<strong>ENSO</strong>’s Impacts on <strong>Atlantic</strong> <strong>Basin</strong> TCs <strong>and</strong> RI<br />
<strong>MJO</strong>’s Impacts on <strong>Atlantic</strong> <strong>Basin</strong> TCs <strong>and</strong> RI<br />
Impact of combined <strong>ENSO</strong>/<strong>MJO</strong> index on <strong>Atlantic</strong> <strong>Basin</strong><br />
TCs <strong>and</strong> RI<br />
Conclusions <strong>and</strong> Future Work
Data Sources<br />
<strong>ENSO</strong> Index: Multivariate <strong>ENSO</strong> Index (MEI) – take August-October<br />
average – highest ten years (El Niño), middle 16 years (neutral) –<br />
lowest ten years (La Niña)<br />
<strong>MJO</strong> Index: Wheeler-Hendon (WH) Index – uses OLR <strong>and</strong> 200- <strong>and</strong> 850-<br />
mb zonal wind components – available since 1974, except for 1978<br />
when OLR was unavailable (120-Day Mean <strong>and</strong> <strong>ENSO</strong> removed)<br />
<strong>MJO</strong>-<strong>ENSO</strong> Index: Developed by WH – Includes 120-Day Mean <strong>and</strong><br />
<strong>ENSO</strong><br />
TC Statistics – National Hurricane Center’s best track<br />
Large-Scale Analysis – NCEP/NCAR Reanalysis I
<strong>ENSO</strong>’s Impacts on<br />
<strong>Atlantic</strong> <strong>Basin</strong> TCs <strong>and</strong> RI
Gray (1984)
Average per Year 24-Hour Periods for Systems Undergoing RI for<br />
Various Thresholds – All <strong>Atlantic</strong> <strong>Basin</strong> TCs<br />
La Niña<br />
Neutral<br />
El Niño
Average per Year 24-Hour Periods for Systems Undergoing RI for<br />
Various Thresholds – MDR TCs (7.5-22.5°N, 75-20°W)<br />
La Niña<br />
Neutral<br />
El Niño
Tracks of 24-Hour RI >= 30 Knots for MDR TCs in La Niña vs.<br />
El Niño (1974-2010)<br />
La Niña<br />
151 24-Hour<br />
RI Events<br />
El Niño<br />
21 24-Hour<br />
RI Events
Percentage Chance of All <strong>Atlantic</strong> <strong>Basin</strong> TCs <strong>and</strong> TCs Forming in <strong>the</strong> MDR in Each Phase<br />
of <strong>ENSO</strong> Having a RI Event of 25 Knots, 30 Knots, 35 Knots <strong>and</strong> 40+ Knots Over 24 h<br />
<strong>ENSO</strong><br />
Phase<br />
25 kt 30 kt 35 kt 40 kt<br />
All TCs<br />
La Niña 53% 43% 29% 23%<br />
Neutral 46% 36% 22% 14%<br />
El Niño 39% 27% 17% 12%<br />
MDR TCs<br />
La Niña 67% 58% 39% 32%<br />
Neutral 60% 50% 35% 23%<br />
El Niño 36% 28% 20% 12%
<strong>MJO</strong>’s Impacts on <strong>Atlantic</strong><br />
<strong>Basin</strong> TCs <strong>and</strong> RI
July-October 200-mb Velocity Potential Anomalies<br />
Associated with <strong>the</strong> Madden-Julian Oscillation (<strong>MJO</strong>) – as<br />
defined by <strong>the</strong> Wheeler-Hendon (WH) index
SLP<br />
Phase 1-2 –<br />
Phase 6-7<br />
850-mb U<br />
200-mb U<br />
700-mb RH
Maloney <strong>and</strong> Hartmann (2000)
Normalized Values for Various TC Parameters in <strong>the</strong> <strong>Atlantic</strong><br />
basin from 1974-2007 based on <strong>MJO</strong> Day of Formation<br />
<strong>MJO</strong> Phase NS NSD H HD MH MHD ACE<br />
Phase 1 6.4 35.9 3.7 17.9 1.8 5.3 76.2<br />
Phase 2 7.5 43.0 5.0 18.4 2.1 4.6 76.7<br />
Phase 3 6.3 30.8 3.0 14.7 1.4 2.8 56.0<br />
Phase 4 5.1 25.5 3.5 12.3 1.0 2.8 49.4<br />
Phase 5 5.1 22.6 2.9 9.5 1.2 2.1 40.0<br />
Phase 6 5.3 24.4 3.2 7.8 0.8 1.1 35.7<br />
Phase 7 3.6 18.1 1.8 7.2 1.1 2.0 33.2<br />
Phase 8 6.2 27.0 3.3 10.4 0.9 2.6 46.8<br />
Phase 1-2 7.0 39.4 4.3 18.1 1.9 4.9 76.5<br />
Phase 6-7 4.5 21.5 2.5 7.5 1.0 1.5 34.6<br />
Phase 1-2 /<br />
Phase 6-7<br />
1.6 1.8 1.7 2.4 2.0 3.2 2.2<br />
Klotzbach (2010)
Normalized number of 24-Hour periods for TCs undergoing RI –<br />
in <strong>the</strong> MDR (1974-2010) – <strong>MJO</strong> Amplitude Greater than One<br />
<strong>MJO</strong> Phase 25 kt 30 kt 35 kt 40+kt<br />
Phase 1 22.0 13.7 8.1 6.1<br />
Phase 2 22.4 14.6 9.3 6.8<br />
Phase 3 6.9 2.8 1.4 0.9<br />
Phase 4 14.5 9.0 4.3 2.7<br />
Phase 5 6.8 4.8 2.4 1.8<br />
Phase 6 6.8 3.9 1.9 0.6<br />
Phase 7 1.5 0.5 0.5 0.0<br />
Phase 8 5.8 4.5 2.2 0.9<br />
Phase 1-2 / Phase 6-7 5.4 6.3 7.2 18.6
Percentage Chance of TCs Forming in <strong>the</strong> MDR in Each Phase of <strong>the</strong> <strong>MJO</strong> Having a RI Event<br />
of 25 Knots, 30 Knots, 35 Knots <strong>and</strong> 40+ Knots Over 24 h – <strong>MJO</strong> Greater than one SD<br />
<strong>MJO</strong> Phase 25 kt 30 kt 35 kt 40+ kt<br />
1 84% 74% 53% 42%<br />
2 69% 62% 42% 35%<br />
3 56% 22% 11% 11%<br />
4 62% 54% 38% 23%<br />
5 47% 41% 29% 12%<br />
6 38% 23% 23% 8%<br />
7 20% 20% 20% 0%<br />
8 40% 40% 40% 20%<br />
Phase 1+2 76% 67% 47% 38%<br />
Phase 6+7 33% 22% 22% 6%
Combined <strong>ENSO</strong>/<strong>MJO</strong><br />
Impacts on <strong>Atlantic</strong> <strong>Basin</strong><br />
TCs <strong>and</strong> RI
Anomalous Vertical Motion Associated<br />
with WH-Combined Index – Solid Lines<br />
represent anomalous vertical motion<br />
associated with <strong>MJO</strong>, dashed lines<br />
represent anomalous vertical motion<br />
associated with <strong>ENSO</strong>
WH-Combined Average Anomalies from July 1 – October 31 by <strong>MJO</strong><br />
Phase (greater than 1 St<strong>and</strong>ard Deviation)<br />
<strong>MJO</strong><br />
Phase<br />
Days per<br />
Phase<br />
200-<br />
mb U<br />
850-<br />
mb U<br />
200-850<br />
mb U<br />
SST SLP 700 mb<br />
RH<br />
300 mb ω OLR<br />
1 327 -1.60 0.09 -1.69 0.00 -0.25 0.49 -0.38 -0.86<br />
2 484 -3.73 0.79 -4.53 0.08 -0.41 1.08 -1.69 -2.70<br />
3 327 -2.49 0.60 -3.10 0.10 -0.19 0.75 -0.11 -0.06<br />
4 370 0.80 -0.23 1.03 0.03 0.10 -0.36 -0.46 1.20<br />
5 420 0.91 -0.29 1.20 -0.07 0.56 -1.06 2.18 3.47<br />
6 347 1.18 -0.76 1.94 -0.13 0.55 -1.44 1.51 1.56<br />
7 325 1.51 -0.55 2.06 -0.16 0.37 0.20 0.99 0.22<br />
8 299 3.42 0.34 3.08 0.16 -0.73 0.34 -2.04 -2.83<br />
Phases 2+3 -3.11 0.70 -3.81 0.09 -0.30 0.92 -0.90 -1.38<br />
Phases 7+8 2.47 -0.10 2.57 0.00 -0.18 0.27 -0.52 -1.30<br />
Phases 2+3 – Phases 7+8 -5.58 0.80 -6.38 0.09 -0.12 0.65 -0.37 -0.08
Tracks of TCs undergoing RI of at least 30 knots in 24 hours<br />
Phases 2-3<br />
43 TCs<br />
Phases 7-8<br />
3 TCs
Normalized number of 24-Hour periods for TCs undergoing<br />
RI – in <strong>the</strong> MDR (1974-2010)<br />
WH-Combined Index 25 kt 30 kt 35 kt 40+kt<br />
Phase 1 20.8 13.1 7.6 5.2<br />
Phase 2 24.2 17.4 11.0 8.9<br />
Phase 3 35.8 21.4 9.5 5.8<br />
Phase 4 4.6 3.2 1.9 1.4<br />
Phase 5 8.1 5.7 3.3 2.1<br />
Phase 6 3.5 1.7 0.0 0.0<br />
Phase 7 0.0 0.0 0.0 0.0<br />
Phase 8 2.0 1.0 0.0 0.0<br />
Phase 2-3 / Phase 7-8 29.0 38.2 ∞ ∞
Percentage Chance of TCs Forming in <strong>the</strong> MDR in Each Phase of <strong>the</strong> WH-Combined Index<br />
Having a RI Event of 25 Knots, 30 Knots, 35 Knots <strong>and</strong> 40+ Knots Over 24 h<br />
WH-Combined 25 kt 30 kt 35 kt 40 kt<br />
1 100% 77% 46% 38%<br />
2 69% 66% 47% 47%<br />
3 83% 71% 50% 33%<br />
4 42% 33% 25% 17%<br />
5 67% 53% 40% 20%<br />
6 25% 17% 17% 0%<br />
7 0% 0% 0% 0%<br />
8 33% 33% 0% 0%<br />
Phase 2+3 75% 68% 48% 41%<br />
Phase 7+8 17% 17% 0% 0%
Conclusions <strong>and</strong> Future Work<br />
• Combining anomalies driven by <strong>ENSO</strong> (on <strong>the</strong> seasonal timescale) <strong>and</strong><br />
<strong>the</strong> <strong>MJO</strong> (on <strong>the</strong> sub-seasonal timescale) makes for a powerful<br />
predictor for TC formation as well as RI<br />
• TC alterations appear to be primarily driven by fluctuations in vertical<br />
wind shear anomalies<br />
• Can <strong>the</strong> combined <strong>MJO</strong>/<strong>ENSO</strong> index aid in predictions of rapid<br />
intensification?<br />
• Does <strong>the</strong> <strong>MJO</strong>/<strong>ENSO</strong> index show similar levels of skill in o<strong>the</strong>r tropical<br />
cyclone basins?


