Differential Effects of Nitrogen Limitation on ... - Plant Physiology
Differential Effects of Nitrogen Limitation on ... - Plant Physiology
Differential Effects of Nitrogen Limitation on ... - Plant Physiology

You also want an ePaper? Increase the reach of your titles
YUMPU automatically turns print PDFs into web optimized ePapers that Google loves.
690 Berges et al.<br />
<strong>Plant</strong> Physiol. Vol. 110, 1996<br />
<str<strong>on</strong>g>of</str<strong>on</strong>g> active PSI and PSII reacti<strong>on</strong> centers using standard biophysical<br />
techniques and compared maximum TEs and fluorescence<br />
yields to determine where the effects <str<strong>on</strong>g>of</str<strong>on</strong>g> nitrogen<br />
deficiency occurred. In additi<strong>on</strong>, for the diatom, we compared<br />
fluorescence and photoacoustic techniques in detail<br />
by estimating the functi<strong>on</strong>al absorpti<strong>on</strong> cross-secti<strong>on</strong> for<br />
PSII using both techniques.<br />
MATERIALS AND METHODS<br />
The diatom Tkalassiosira weissflogii (Gru.) Fryxell et Hasle<br />
(cl<strong>on</strong>e T-VIC) and the chlorophyte Dunaliella tertiolecta<br />
Butcher (cl<strong>on</strong>e DUN) were grown in 1-L semic<strong>on</strong>tinuous<br />
batch cultures in artificial seawater medium (Goldman and<br />
McCarthy, 1978) enriched with f/2 nutrients (Guillard and<br />
Ryther, 1962), except that silica levels were increased to 220<br />
p~ and 1 nM selenous acid was added. Cultures were<br />
grown in c<strong>on</strong>tinuous light (200 pE m-’ s-l) at 18°C and<br />
were bubbled with filtered air. The cyanobacterium Syneckococcus<br />
sp. PCC 7002 was grown in 250-mL flasks <strong>on</strong> A+<br />
medium (Bruce et al., 1989) at 37°C under 150 pE m-’s-l<br />
with c<strong>on</strong>stant shaking. <str<strong>on</strong>g>Nitrogen</str<strong>on</strong>g>-replete cells were maintained<br />
in logarithmic growth phase by additi<strong>on</strong>s <str<strong>on</strong>g>of</str<strong>on</strong>g> fresh<br />
medium; nitrate never decreased to less than 250 p ~ Ni- .<br />
trogen-starved cells were allowed to deplete medium initially<br />
c<strong>on</strong>taining 150 p~ NO,- below detecti<strong>on</strong> limits and<br />
were allowed to grow into stati<strong>on</strong>ary phase for several<br />
days before they were sampled.<br />
For T. weissflogii and D. tertiolecta, cell numbers and<br />
volumes were determined using a model TA11 Coulter<br />
Counter (Coulter, Hialeah, FL) equipped with a populati<strong>on</strong><br />
accessory and a 100-pm aperture and calibrated with latex<br />
microspheres. Chl a and carotenoids were measured spectrophotometrically<br />
<strong>on</strong> samples filtered <strong>on</strong>to Whatman<br />
GF/F filters and extracted in 90% aqueous acet<strong>on</strong>e (Jeffrey<br />
and’Humphrey, 1975). In vivo absorpti<strong>on</strong> spectra (375-750<br />
nm) were determined using a DW 2C spectrophotometer<br />
(Aminco, Beverly, MA) (Dubinsky et al., 1986). Oxygen<br />
flash yields and Chl a:P,,, ratios were measured as described<br />
by Falkowski et al. (1981) and used to calculate Chl<br />
a:O,, Chl a:PSII, Chl a:PSI, and the number <str<strong>on</strong>g>of</str<strong>on</strong>g> functi<strong>on</strong>al<br />
reacti<strong>on</strong> centers per cell.<br />
For both fluorescence and photoacoustic measurements,<br />
data were collected from three to six separately grown,<br />
replicate cultures over a period <str<strong>on</strong>g>of</str<strong>on</strong>g> several m<strong>on</strong>ths. Subsamples<br />
from each culture were filtered <strong>on</strong>to 13-mm Millipore<br />
filters (8-pm pore size) and placed in a photoacoustic<br />
cell as described by Cha and Mauzerall (1992). A fourlegged<br />
fiber-optic light pipe (comm<strong>on</strong> end diameter 12<br />
mm) was fixed above the sample chamber. For both fluorescence<br />
and PPA analyses, pulsed light at 620 nm (22.5<br />
nm half-bandwidth) was provided by a 1-ps dye laser<br />
(model LFDL-2; Candela, Wayland, MD), using Kit<strong>on</strong> Red<br />
dye (70 p~ in CH,OH) through <strong>on</strong>e leg. We selected 620<br />
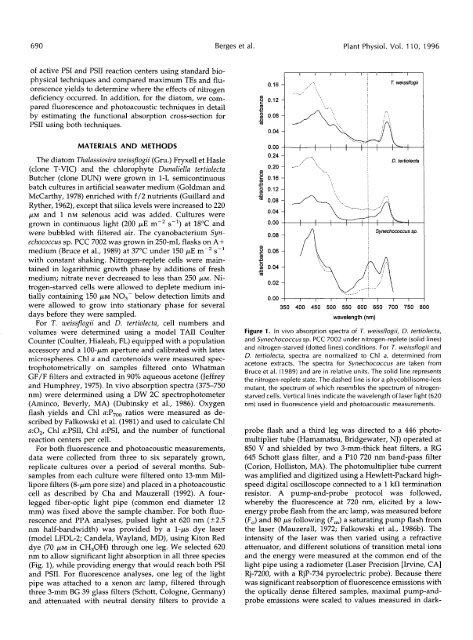
nm to allow significant light absorpti<strong>on</strong> in a11 three species<br />
(Fig. I), while providing energy that would reach both PSI<br />
and PSII. For fluorescence analyses, <strong>on</strong>e leg <str<strong>on</strong>g>of</str<strong>on</strong>g> the light<br />
pipe was attached to a xen<strong>on</strong> arc lamp, filtered through<br />
three 3-mm BG 39 glass filters (Schott, Cologne, Germany)<br />
and attenuated with neutra1 density filters to provide a<br />
016 1<br />
O 04 -<br />
o O0<br />
0.241<br />
020-1<br />
I I I I I I I 7<br />
I<br />
T weissf/ogii<br />
I<br />
O 04 -1<br />
O00 I<br />
I I I<br />
I<br />
I I I I<br />
I<br />
I<br />
n<br />
D teitiolecfa<br />
350 400 450 500 550 600 650 700 750 800<br />
wavelength (nm)<br />
Figure 1. In vivo absorpti<strong>on</strong> spectra <str<strong>on</strong>g>of</str<strong>on</strong>g> T. weissflogii, D. tertiolecta,<br />
and Synechococcus sp. PCC 7002 under nitrogen-replete (solid lines)<br />
and nitrogen-starved (dotted lines) c<strong>on</strong>diti<strong>on</strong>s. For T. weissflogii and<br />
D. tertiolecta, spectra are normalized to Chl a, determined from<br />
acet<strong>on</strong>e extracts. The spectra for Synechococcus are taken from<br />
Bruce et al. (1989) and are in relative units. The solid line represents<br />
the nitrogen-replete state. The dashed line is for a phycobilisome-less<br />
mutant, the spectrum <str<strong>on</strong>g>of</str<strong>on</strong>g> which resembles the spectrum <str<strong>on</strong>g>of</str<strong>on</strong>g> nitrogenstarved<br />
cells. Vertical lines indicate the wavelength <str<strong>on</strong>g>of</str<strong>on</strong>g> laser light (620<br />
nm) used in fluorescence yield and photoacoustic measurements.<br />
probe flash and a third leg was directed to a 446 photomultiplier<br />
tube (Hamamatsu, Bridgewater, NJ) operated at<br />
850 V and shielded by two 3-mm-thick heat filters, a RG<br />
645 Schott glass filter, and a P10 720 nm band-pass filter<br />
(Cori<strong>on</strong>, Hollist<strong>on</strong>, MA). The photomultiplier tube current<br />
was amplified and digitized using a Hewlett-Packard highspeed<br />
digital oscilloscope c<strong>on</strong>nected to a 1 kR terminati<strong>on</strong><br />
resistor. A pump-and-probe protocol was followed,<br />
whereby the fluorescence at 720 nm, elicited by a lowenergy<br />
probe flash from the arc lamp, was measured before<br />
(F,) and 80 ps following (F,) a saturating pump flash from<br />
the laser (Mauzerall, 1972; Falkowski et al., 1986b). The<br />
intensity <str<strong>on</strong>g>of</str<strong>on</strong>g> the laser was then varied using a refractive<br />
attenuator, and different soluti<strong>on</strong>s <str<strong>on</strong>g>of</str<strong>on</strong>g> transiti<strong>on</strong> metal i<strong>on</strong>s<br />
and the energy were measured at the comm<strong>on</strong> end <str<strong>on</strong>g>of</str<strong>on</strong>g> the<br />
light pipe using a radiometer (Laser Precisi<strong>on</strong> [Irvine, CAI<br />
Rj-7200, with a RjP-734 pyroelectric probe). Because there<br />
was significant reabsorpti<strong>on</strong> <str<strong>on</strong>g>of</str<strong>on</strong>g> fluorescence emissi<strong>on</strong>s with<br />
the optically dense filtered samples, maximal pump-andprobe<br />
emissi<strong>on</strong>s were scaled to values measured in dark-