LSR4326P Spec Sheet - JBL Professional
LSR4326P Spec Sheet - JBL Professional
LSR4326P Spec Sheet - JBL Professional

You also want an ePaper? Increase the reach of your titles
YUMPU automatically turns print PDFs into web optimized ePapers that Google loves.
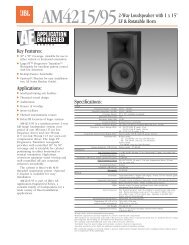
<strong>LSR4326P</strong> Linear Spatial Reference Bi-amplified Studio Monitor<br />
Automated RMC Room Mode Correction System<br />
Room modes” (sometimes called “standing waves”) can<br />
produce a low frequency resonance that gives a misleading<br />
impression of bass response at the listening position.<br />
RMC (short for “Room Mode Correction”) in the LSR4300<br />
series automatically analyzes the frequency response of<br />
the speakers at the listening position and automatically<br />
applies a corrective filter to minimize low frequency resonance.<br />
When the calibration mic is connected and the<br />
RMC analysis is initiated the LSR4300 RMC system applies<br />
a parametric filter at any of 73 frequencies (1/24th octave<br />
centers) between 20 Hz and 160 Hz, with a variable Q<br />
from 1 (1.4 octave bandwidth) to 16 (1/11th octave bandwidth),<br />
with 3 to 12 dB of attenuation.<br />
During the RMC calibration process, speaker levels are<br />
trimmed in 0.25 dB increments so that all speakers in the<br />
system produce equal SPL (sound pressure level) at the<br />
mix position.<br />
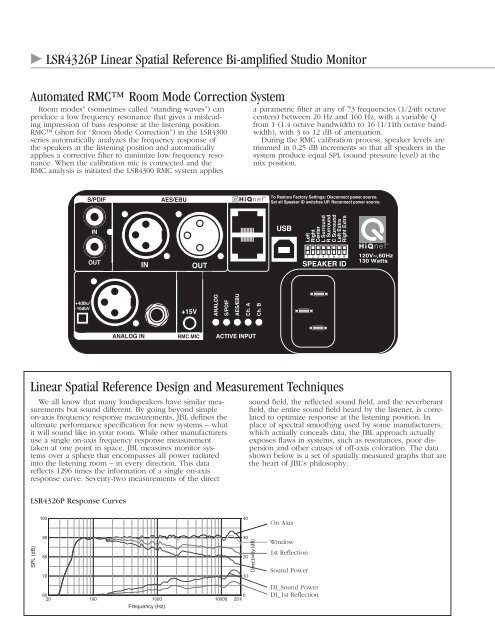
Linear Spatial Reference Design and Measurement Techniques<br />
We all know that many loudspeakers have similar measurements<br />
but sound different. By going beyond simple<br />
on-axis frequency response measurements, <strong>JBL</strong> defines the<br />
ultimate performance specification for new systems – what<br />
it will sound like in your room. While other manufacturers<br />
use a single on-axis frequency response measurement<br />
taken at one point in space, <strong>JBL</strong> measures monitor systems<br />
over a sphere that encompasses all power radiated<br />
into the listening room – in every direction. This data<br />
reflects 1296 times the information of a single on-axis<br />
response curve. Seventy-two measurements of the direct<br />
sound field, the reflected sound field, and the reverberant<br />
field, the entire sound field heard by the listener, is correlated<br />
to optimize response at the listening position. In<br />
place of spectral smoothing used by some manufacturers,<br />
which actually conceals data, the <strong>JBL</strong> approach actually<br />
exposes flaws in systems, such as resonances, poor dispersion<br />
and other causes of off-axis coloration. The data<br />
shown below is a set of spatially measured graphs that are<br />
the heart of <strong>JBL</strong>’s philosophy.<br />
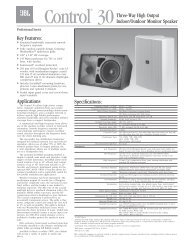
<strong>LSR4326P</strong> Response Curves<br />
On Axis<br />
Window<br />
1st Reflection<br />
Sound Power<br />
DI_Sound Power<br />
DI_1st Reflection