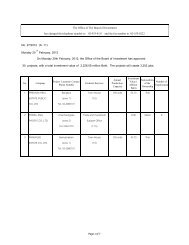
Japan - The Board of Investment of Thailand
Japan - The Board of Investment of Thailand
Japan - The Board of Investment of Thailand

Create successful ePaper yourself
Turn your PDF publications into a flip-book with our unique Google optimized e-Paper software.
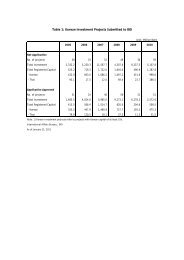
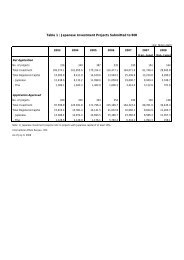
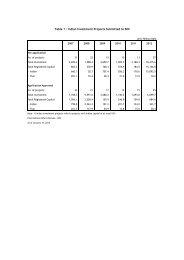
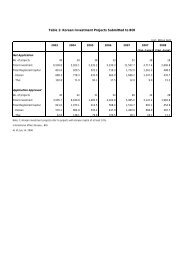
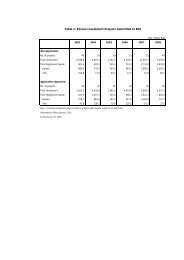
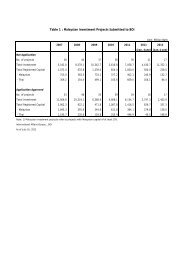
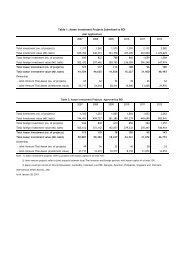
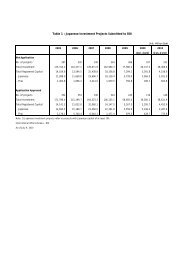
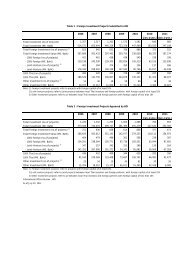
Table 4 : <strong>Japan</strong>ese <strong>Investment</strong> Projects Applying for Promotion Classified by SectorUnit: Million BahtYear200720082009201020112011 (Jan.-June) 2012 (Jan.-June)Sector No. <strong>of</strong> <strong>Investment</strong> No. <strong>of</strong> <strong>Investment</strong> No. <strong>of</strong> <strong>Investment</strong> No. <strong>of</strong> <strong>Investment</strong> No. <strong>of</strong> <strong>Investment</strong> No. <strong>of</strong> <strong>Investment</strong> No. <strong>of</strong> <strong>Investment</strong>Projects Projects Projects Projects Projects Projects ProjectsAgricultural Products 14 3,998.6 12 10,628.0 15 5,928.1 14 7,106.5 18 5,022.6 7 1,789.5 10 5,581.7Minerals and Ceramics 11 5,001.9 12 6,740.1 2 600.1 8 1,642.5 27 21,536.8 14 4,103.7 9 3,340.2Light Industries/Textiles 10 1,253.3 11 3,394.3 12 1,078.8 8 2,533.5 13 2,264.8 6 1,768.2 10 3,818.2Metal Products and Machinery 121 88,439.6 128 56,805.3 100 16,667.2 156 46,615.7 272 81,433.3 148 42,826.8 182 99,223.7Electric and Electronic Products 51 21,156.3 53 15,284.9 49 36,179.4 66 33,295.6 89 46,023.3 38 10,659.7 73 46,945.2Chemicals and Paper 47 20,638.7 37 5,497.9 26 6,841.2 52 8,102.2 57 31,396.1 27 10,414.2 57 10,878.8Services 76 8,583.5 71 4,643.8 62 10,085.4 60 5,147.0 84 6,166.6 32 682.2 48 6,509.9Total 330 149,071.9 324 102,994.3 266 77,380.2 364 104,443.0 560 193,843.5 272 72,244.3 389 176,297.7Note: 1) <strong>Japan</strong>ese investment projects refer to projects with <strong>Japan</strong>ese capital <strong>of</strong> at least 10%.Table 5 : <strong>Japan</strong>ese <strong>Investment</strong> Projects Approved by BOI Classified by SectorUnit: Million BahtYear200720082009201020112011 (Jan.-June 2012 (Jan.-JuneSector No. <strong>of</strong> <strong>Investment</strong> No. <strong>of</strong> <strong>Investment</strong> No. <strong>of</strong> <strong>Investment</strong> No. <strong>of</strong> <strong>Investment</strong> No. <strong>of</strong> <strong>Investment</strong> No. <strong>of</strong> <strong>Investment</strong> No. <strong>of</strong> <strong>Investment</strong>Projects Projects Projects Projects Projects Projects ProjectsAgricultural Products 12 5,498.9 14 4,800.2 12 10,166.8 15 4,322.5 14 8,102.4 6 1,129.3 8 1,999.0Minerals and Ceramics 10 17,355.3 15 8,441.0 6 2,813.5 6 1,222.5 21 14,943.8 11 12,029.0 10 16,134.2Light Industries/Textiles 11 2,147.1 10 3,416.7 8 1,234.4 7 661.6 13 4,045.0 8 3,945.6 8 2,005.4Metal Products and Machinery 118 77,071.9 120 64,189.2 98 19,756.3 137 29,890.7 234 66,851.0 123 36,446.0 117 38,457.4Electric and Electronic Products 59 32,111.1 49 14,271.2 38 15,874.1 69 46,383.3 83 36,886.1 37 13,621.3 55 29,262.9Chemicals and Paper 44 18,683.2 39 7,257.9 23 5,174.0 49 8,695.3 51 25,744.6 26 15,794.9 38 13,412.8Services 76 11,455.7 77 3,778.9 58 3,886.3 59 9,129.5 68 2,394.7 30 4,508.0 55 5,008.8Total 330 164,323.2 324 106,155.1 243 58,905.4 342 100,305.4 484 158,967.6 241 87,474.1 291 106,280.5Note: 1) <strong>Japan</strong>ese investment projects refer to projects with <strong>Japan</strong>ese capital <strong>of</strong> at least 10%.International Affairs Bureau., BOIAs <strong>of</strong> July 9, 2012