- Page 1 and 2: Sustainable Streets:2013 and Beyond
- Page 3 and 4: CONTENTS4 Letter from the Mayor5 Co
- Page 5 and 6: Letter from the MayorDear Friends:T
- Page 8: Introduction44acres red paintedbus
- Page 11 and 12: 10Safety
- Page 13 and 14: SAFETYSustainable Streets set the g
- Page 15 and 16: SAFETYchildren and the elderly. On
- Page 17 and 18: SAFETY16
- Page 19 and 20: SAFETYAt locations where major engi
- Page 21 and 22: SAFETY14%decrease in crashesafter S
- Page 23 and 24: SAFETY21%decrease in crashesafter D
- Page 25 and 26: SAFETY84%decrease in pedestrianinju
- Page 27 and 28: SAFETY“Interventions to make the
- Page 29 and 30: SAFETY73%decrease in risk ofserious
- Page 31 and 32: SAFETY36%decline in frequencyof inj
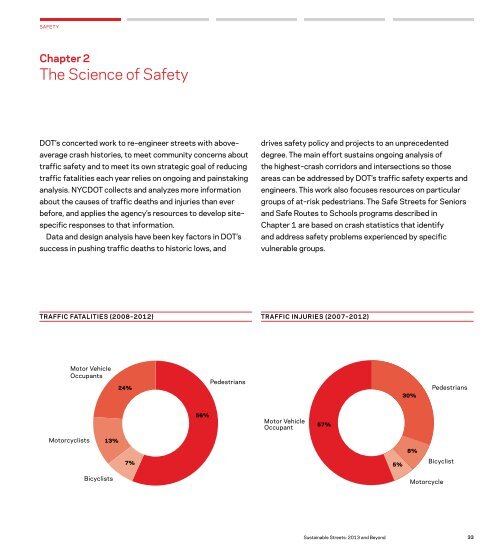
- Page 33: SAFETY32
- Page 37 and 38: SAFETY36
- Page 39 and 40: SAFETY38
- Page 41 and 42: SAFETYSCHOOL SPEED ZONESTo compleme
- Page 43 and 44: SAFETYAs the number of red light ca
- Page 45 and 46: SAFETYDOT staff visited 4,000 busin
- Page 47 and 48: SAFETY46
- Page 49 and 50: SAFETY41%decrease in crashes atHarl
- Page 51 and 52: SAFETYFOURTH AVENUE, BROOKLYNReside
- Page 53 and 54: SAFETYOne quarter of New Yorkers su
- Page 55 and 56: SAFETYCurbside Haikus generated a b
- Page 57 and 58: SAFETYThe DOT’s 5 Safety City fac
- Page 60 and 61: SAFETYLooking AheadNew York City mu
- Page 62 and 63: MOBILITYIntroduction44acres of pain
- Page 64 and 65: MOBILITYMOBILITYSustainable Streets
- Page 66 and 67: MOBILITYChapter 5Better Bus Service
- Page 68 and 69: MOBILITYMOBILITYSustainable Streets
- Page 70 and 71: MOBILITY10%increased ridershipon th
- Page 72 and 73: MOBILITYAdditional Bus Priority Pro
- Page 74 and 75: MOBILITYSustainable Streets: 2013 a
- Page 76 and 77: MOBILITYNYCDOT identified dozens of
- Page 78 and 79: MOBILITYREGULATING INTERCITY BUSEST
- Page 80 and 81: MOBILITYChapter 6A City of Rivers a
- Page 82 and 83: MOBILITYSTATEN ISLAND FERRYEAST RIV
- Page 84 and 85:
MOBILITYChapter 7Streets for All:Im
- Page 86 and 87:
MOBILITYIn corridors like Kent Aven
- Page 88 and 89:
MOBILITYSustainable Streets: 2013 a
- Page 90 and 91:
MOBILITYSustainable Streets: 2013 a
- Page 92 and 93:
MOBILITYBUILDINGS THAT ALLOW ACCESS
- Page 94 and 95:
MOBILITY5million trips in first150
- Page 96 and 97:
MOBILITYSome CitiBikes are used doz
- Page 98 and 99:
MOBILITY86%increase in wintercyclin
- Page 100 and 101:
MOBILITYNYCDOT has found walking ra
- Page 102 and 103:
MOBILITYWalkNYC provides user-frien
- Page 104 and 105:
MOBILITYSustainable Streets: 2013 a
- Page 106 and 107:
MOBILITYChapter 8Vehicles and Parki
- Page 108 and 109:
MOBILITYNYCDOT converted 13,000 met
- Page 110 and 111:
MOBILITYJACKSON HEIGHTS NEIGHBORHOO
- Page 112 and 113:
MOBILITYSustainable Streets: 2013 a
- Page 114 and 115:
MOBILITYLooking AheadDemand is grow
- Page 116 and 117:
MOBILITYPOSSIBLE BUS RAPID TRANSIT
- Page 118 and 119:
WORLD CLASS STREETSIntroduction72%o
- Page 120 and 121:
WORLD CLASS STREETSSustainable Stre
- Page 122 and 123:
WORLD CLASS STREETSChapter 9Plazas,
- Page 124 and 125:
WORLD CLASS STREETSDOT has created
- Page 126 and 127:
WORLD CLASS STREETS172%increase in
- Page 128 and 129:
WORLD CLASS STREETS“Corona Plaza
- Page 130 and 131:
WORLD CLASS STREETSSustainable Stre
- Page 132 and 133:
WORLD CLASS STREETSSustainable Stre
- Page 134 and 135:
WORLD CLASS STREETSChapter 10Broadw
- Page 136 and 137:
WORLD CLASS STREETS42,000square fee
- Page 138 and 139:
WORLD CLASS STREETSSustainable Stre
- Page 140 and 141:
WORLD CLASS STREETSSurveys indicate
- Page 142 and 143:
WORLD CLASS STREETS72%surveyed in 2
- Page 144 and 145:
WORLD CLASS STREETSChapter 11Design
- Page 146 and 147:
WORLD CLASS STREETSNYC DOT may be t
- Page 148 and 149:
WORLD CLASS STREETSSustainable Stre
- Page 150 and 151:
WORLD CLASS STREETSThe design of NY
- Page 152 and 153:
WORLD CLASS STREETSLooking AheadNYC
- Page 154 and 155:
INFRASTRUCTUREIntroduction$6.0billi
- Page 156 and 157:
INFRASTRUCTURERoosevelt Island Brid
- Page 158 and 159:
INFRASTRUCTURESustainable Streets:
- Page 160 and 161:
INFRASTRUCTUREEach year, New York C
- Page 162 and 163:
INFRASTRUCTUREThe City has installe
- Page 164 and 165:
INFRASTRUCTUREDOT has repaired2,196
- Page 166 and 167:
INFRASTRUCTURETHE DAILY POTHOLE SUB
- Page 168 and 169:
INFRASTRUCTURESTREET WORKS MANUALCi
- Page 170 and 171:
INFRASTRUCTUREThe Sheridan/Hunts Po
- Page 172 and 173:
INFRASTRUCTUREChapter 13A City of B
- Page 174 and 175:
INFRASTRUCTUREManhattan BridgeMANHA
- Page 176 and 177:
INFRASTRUCTURESustainable Streets:
- Page 178 and 179:
INFRASTRUCTUREWILLIS AVENUE BRIDGE1
- Page 180 and 181:
INFRASTRUCTUREWidespread use of sop
- Page 182 and 183:
INFRASTRUCTURE$261million stimulusa
- Page 184 and 185:
INFRASTRUCTUREChapter 14Built-in-Ef
- Page 186 and 187:
INFRASTRUCTUREDOT has removed 50,00
- Page 188 and 189:
INFRASTRUCTURE22million riders use
- Page 190 and 191:
INFRASTRUCTURECAR SHARINGWorking wi
- Page 192 and 193:
INFRASTRUCTURELooking AheadContinue
- Page 194 and 195:
INFRASTRUCTURE INFRASTRUCTURESustai
- Page 196 and 197:
RESILIENCYIntroduction226,000commut
- Page 198 and 199:
RESILIENCYChapter 15Impact of Sandy
- Page 200 and 201:
RESILIENCYSustainable Streets: 2013
- Page 202 and 203:
RESILIENCYAfter Hurricane Sandy, NY
- Page 204 and 205:
RESILIENCYIn the days following Hur
- Page 206 and 207:
RESILIENCYOn Friday November 2, the
- Page 208 and 209:
RESILIENCYSustainable Streets: 2013
- Page 210 and 211:
RESILIENCYLooking AheadFor years en
- Page 212 and 213:
Sustainable Streets: 2013 and Beyon
- Page 214 and 215:
AcknowledgmentsThe remarkable accom
- Page 216:
www.nyc.gov/dotSustainable Streets: