Medicaid estate recovery collections - ASPE - U.S. Department of ...
Medicaid estate recovery collections - ASPE - U.S. Department of ...
Medicaid estate recovery collections - ASPE - U.S. Department of ...

You also want an ePaper? Increase the reach of your titles
YUMPU automatically turns print PDFs into web optimized ePapers that Google loves.
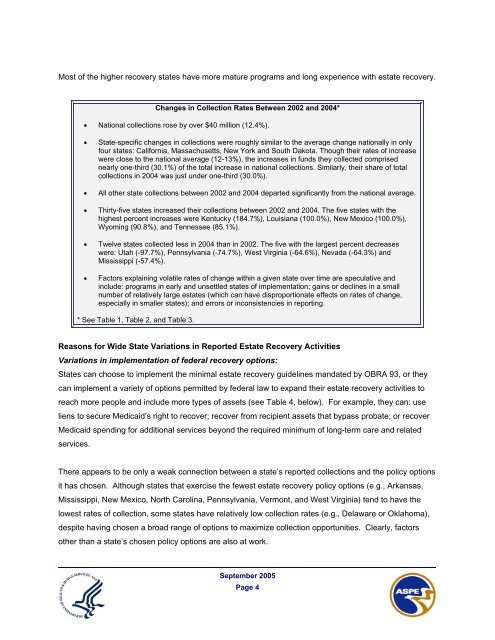
Most <strong>of</strong> the higher <strong>recovery</strong> states have more mature programs and long experience with <strong>estate</strong> <strong>recovery</strong>.Changes in Collection Rates Between 2002 and 2004*• National <strong>collections</strong> rose by over $40 million (12.4%).• State-specific changes in <strong>collections</strong> were roughly similar to the average change nationally in onlyfour states: California, Massachusetts, New York and South Dakota. Though their rates <strong>of</strong> increasewere close to the national average (12-13%), the increases in funds they collected comprisednearly one-third (30.1%) <strong>of</strong> the total increase in national <strong>collections</strong>. Similarly, their share <strong>of</strong> total<strong>collections</strong> in 2004 was just under one-third (30.0%).• All other state <strong>collections</strong> between 2002 and 2004 departed significantly from the national average.• Thirty-five states increased their <strong>collections</strong> between 2002 and 2004. The five states with thehighest percent increases were Kentucky (184.7%), Louisiana (100.0%), New Mexico (100.0%),Wyoming (90.8%), and Tennessee (85.1%).• Twelve states collected less in 2004 than in 2002. The five with the largest percent decreaseswere: Utah (-97.7%), Pennsylvania (-74.7%), West Virginia (-64.6%), Nevada (-64.3%) andMississippi (-57.4%).• Factors explaining volatile rates <strong>of</strong> change within a given state over time are speculative andinclude: programs in early and unsettled states <strong>of</strong> implementation; gains or declines in a smallnumber <strong>of</strong> relatively large <strong>estate</strong>s (which can have disproportionate effects on rates <strong>of</strong> change,especially in smaller states); and errors or inconsistencies in reporting.* See Table 1, Table 2, and Table 3.Reasons for Wide State Variations in Reported Estate Recovery ActivitiesVariations in implementation <strong>of</strong> federal <strong>recovery</strong> options:States can choose to implement the minimal <strong>estate</strong> <strong>recovery</strong> guidelines mandated by OBRA 93, or theycan implement a variety <strong>of</strong> options permitted by federal law to expand their <strong>estate</strong> <strong>recovery</strong> activities toreach more people and include more types <strong>of</strong> assets (see Table 4, below). For example, they can: useliens to secure <strong>Medicaid</strong>’s right to recover; recover from recipient assets that bypass probate; or recover<strong>Medicaid</strong> spending for additional services beyond the required minimum <strong>of</strong> long-term care and relatedservices.There appears to be only a weak connection between a state’s reported <strong>collections</strong> and the policy optionsit has chosen. Although states that exercise the fewest <strong>estate</strong> <strong>recovery</strong> policy options (e.g., Arkansas,Mississippi, New Mexico, North Carolina, Pennsylvania, Vermont, and West Virginia) tend to have thelowest rates <strong>of</strong> collection, some states have relatively low collection rates (e.g., Delaware or Oklahoma),despite having chosen a broad range <strong>of</strong> options to maximize collection opportunities. Clearly, factorsother than a state’s chosen policy options are also at work.September 2005Page 4