Document - IUCN
Document - IUCN
Document - IUCN

Create successful ePaper yourself
Turn your PDF publications into a flip-book with our unique Google optimized e-Paper software.
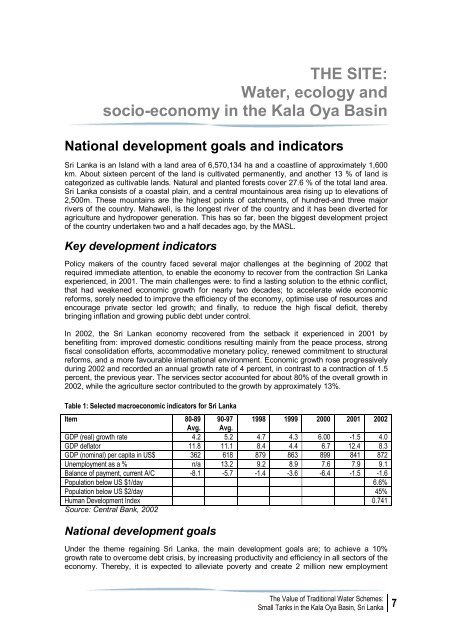
THE SITE:Water, ecology andsocio-economy in the Kala Oya BasinNational development goals and indicatorsSri Lanka is an Island with a land area of 6,570,134 ha and a coastline of approximately 1,600km. About sixteen percent of the land is cultivated permanently, and another 13 % of land iscategorized as cultivable lands. Natural and planted forests cover 27.6 % of the total land area.Sri Lanka consists of a coastal plain, and a central mountainous area rising up to elevations of2,500m. These mountains are the highest points of catchments, of hundred-and three majorrivers of the country. Mahaweli, is the longest river of the country and it has been diverted foragriculture and hydropower generation. This has so far, been the biggest development projectof the country undertaken two and a half decades ago, by the MASL.Key development indicatorsPolicy makers of the country faced several major challenges at the beginning of 2002 thatrequired immediate attention, to enable the economy to recover from the contraction Sri Lankaexperienced, in 2001. The main challenges were: to find a lasting solution to the ethnic conflict,that had weakened economic growth for nearly two decades; to accelerate wide economicreforms, sorely needed to improve the efficiency of the economy, optimise use of resources andencourage private sector led growth; and finally, to reduce the high fiscal deficit, therebybringing inflation and growing public debt under control.In 2002, the Sri Lankan economy recovered from the setback it experienced in 2001 bybenefiting from: improved domestic conditions resulting mainly from the peace process, strongfiscal consolidation efforts, accommodative monetary policy, renewed commitment to structuralreforms, and a more favourable international environment. Economic growth rose progressivelyduring 2002 and recorded an annual growth rate of 4 percent, in contrast to a contraction of 1.5percent, the previous year. The services sector accounted for about 80% of the overall growth in2002, while the agriculture sector contributed to the growth by approximately 13%.Table 1: Selected macroeconomic indicators for Sri LankaItem 80-89 90-97 1998 1999 2000 2001 2002Avg. Avg.GDP (real) growth rate 4.2 5.2 4.7 4.3 6.00 -1.5 4.0GDP deflator 11.8 11.1 8.4 4.4 6.7 12.4 8.3GDP (nominal) per capita in US$ 362 618 879 863 899 841 872Unemployment as a % n/a 13.2 9.2 8.9 7.6 7.9 9.1Balance of payment, current A/C -8.1 -5.7 -1.4 -3.6 -6.4 -1.5 -1.6Population below US $1/day 6.6%Population below US $2/day 45%Human Development Index 0.741Source: Central Bank, 2002National development goalsUnder the theme regaining Sri Lanka, the main development goals are; to achieve a 10%growth rate to overcome debt crisis, by increasing productivity and efficiency in all sectors of theeconomy. Thereby, it is expected to alleviate poverty and create 2 million new employmentThe Value of Traditional Water Schemes:Small Tanks in the Kala Oya Basin, Sri Lanka7